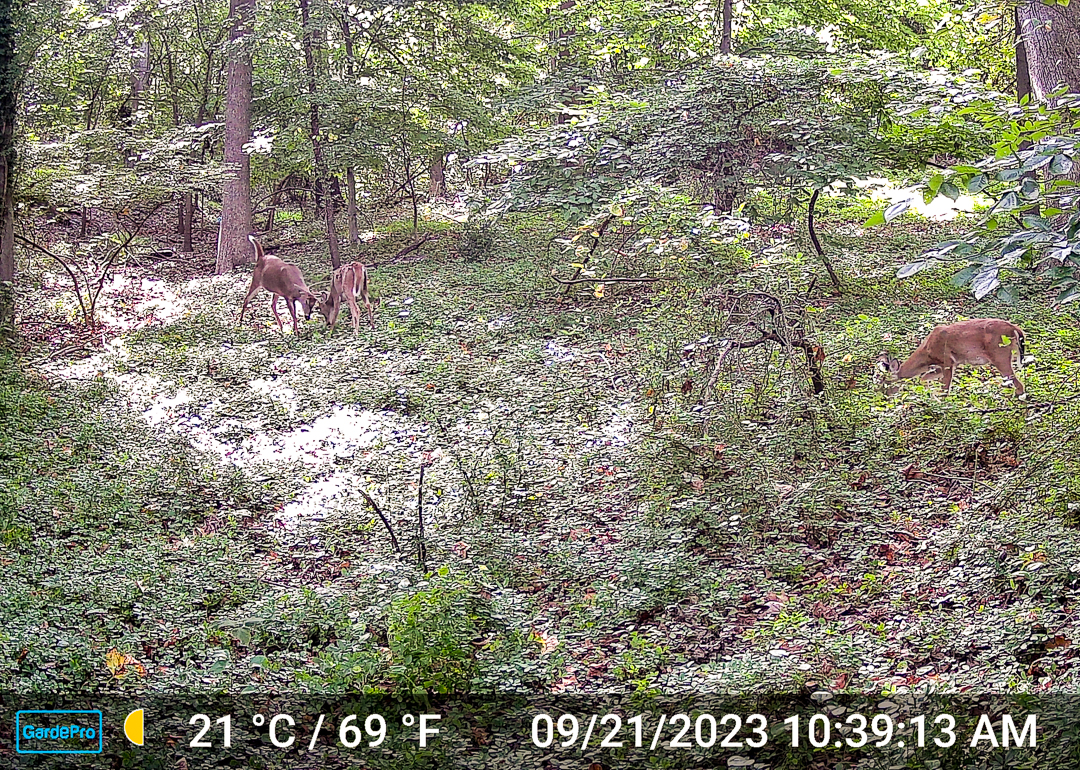
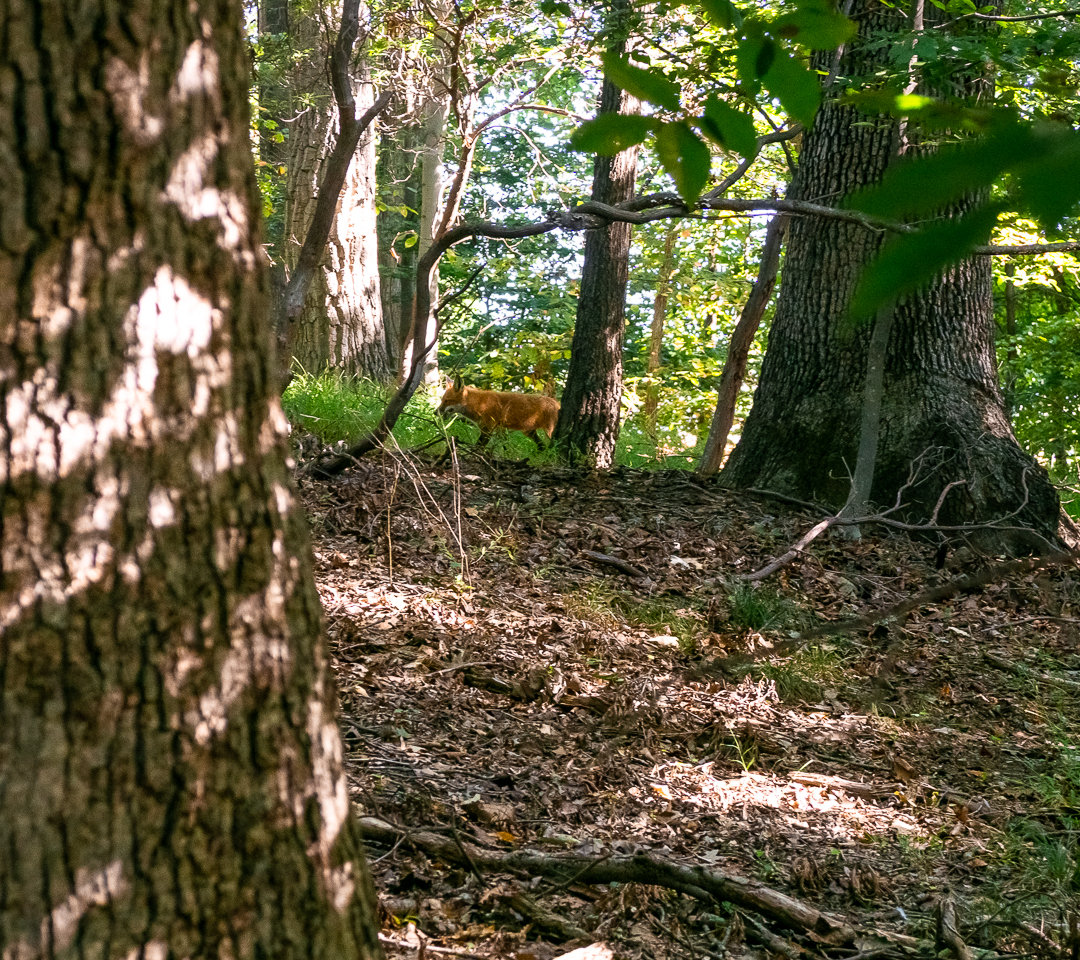
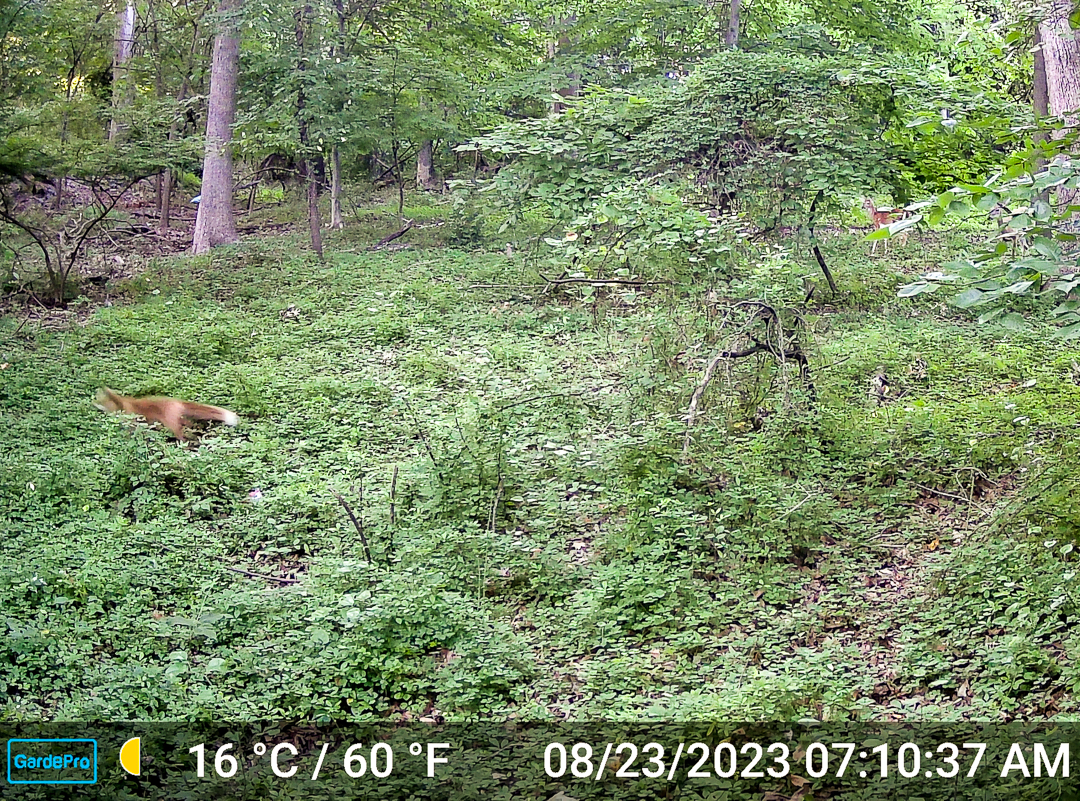
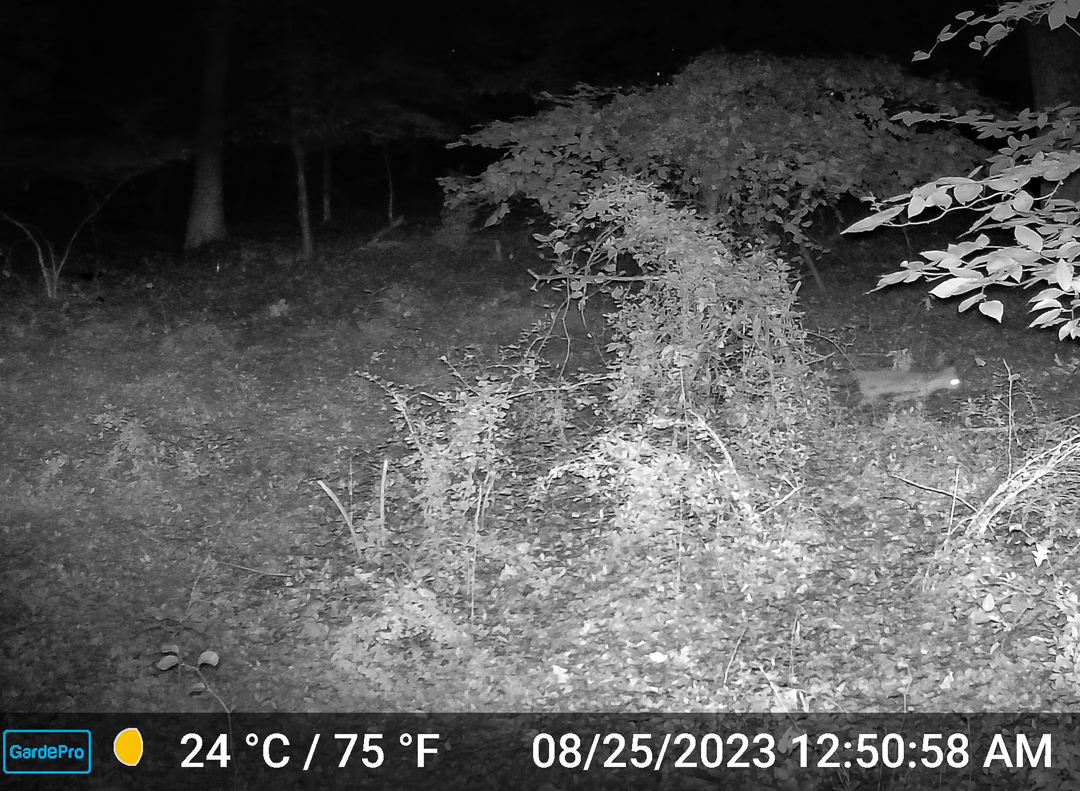
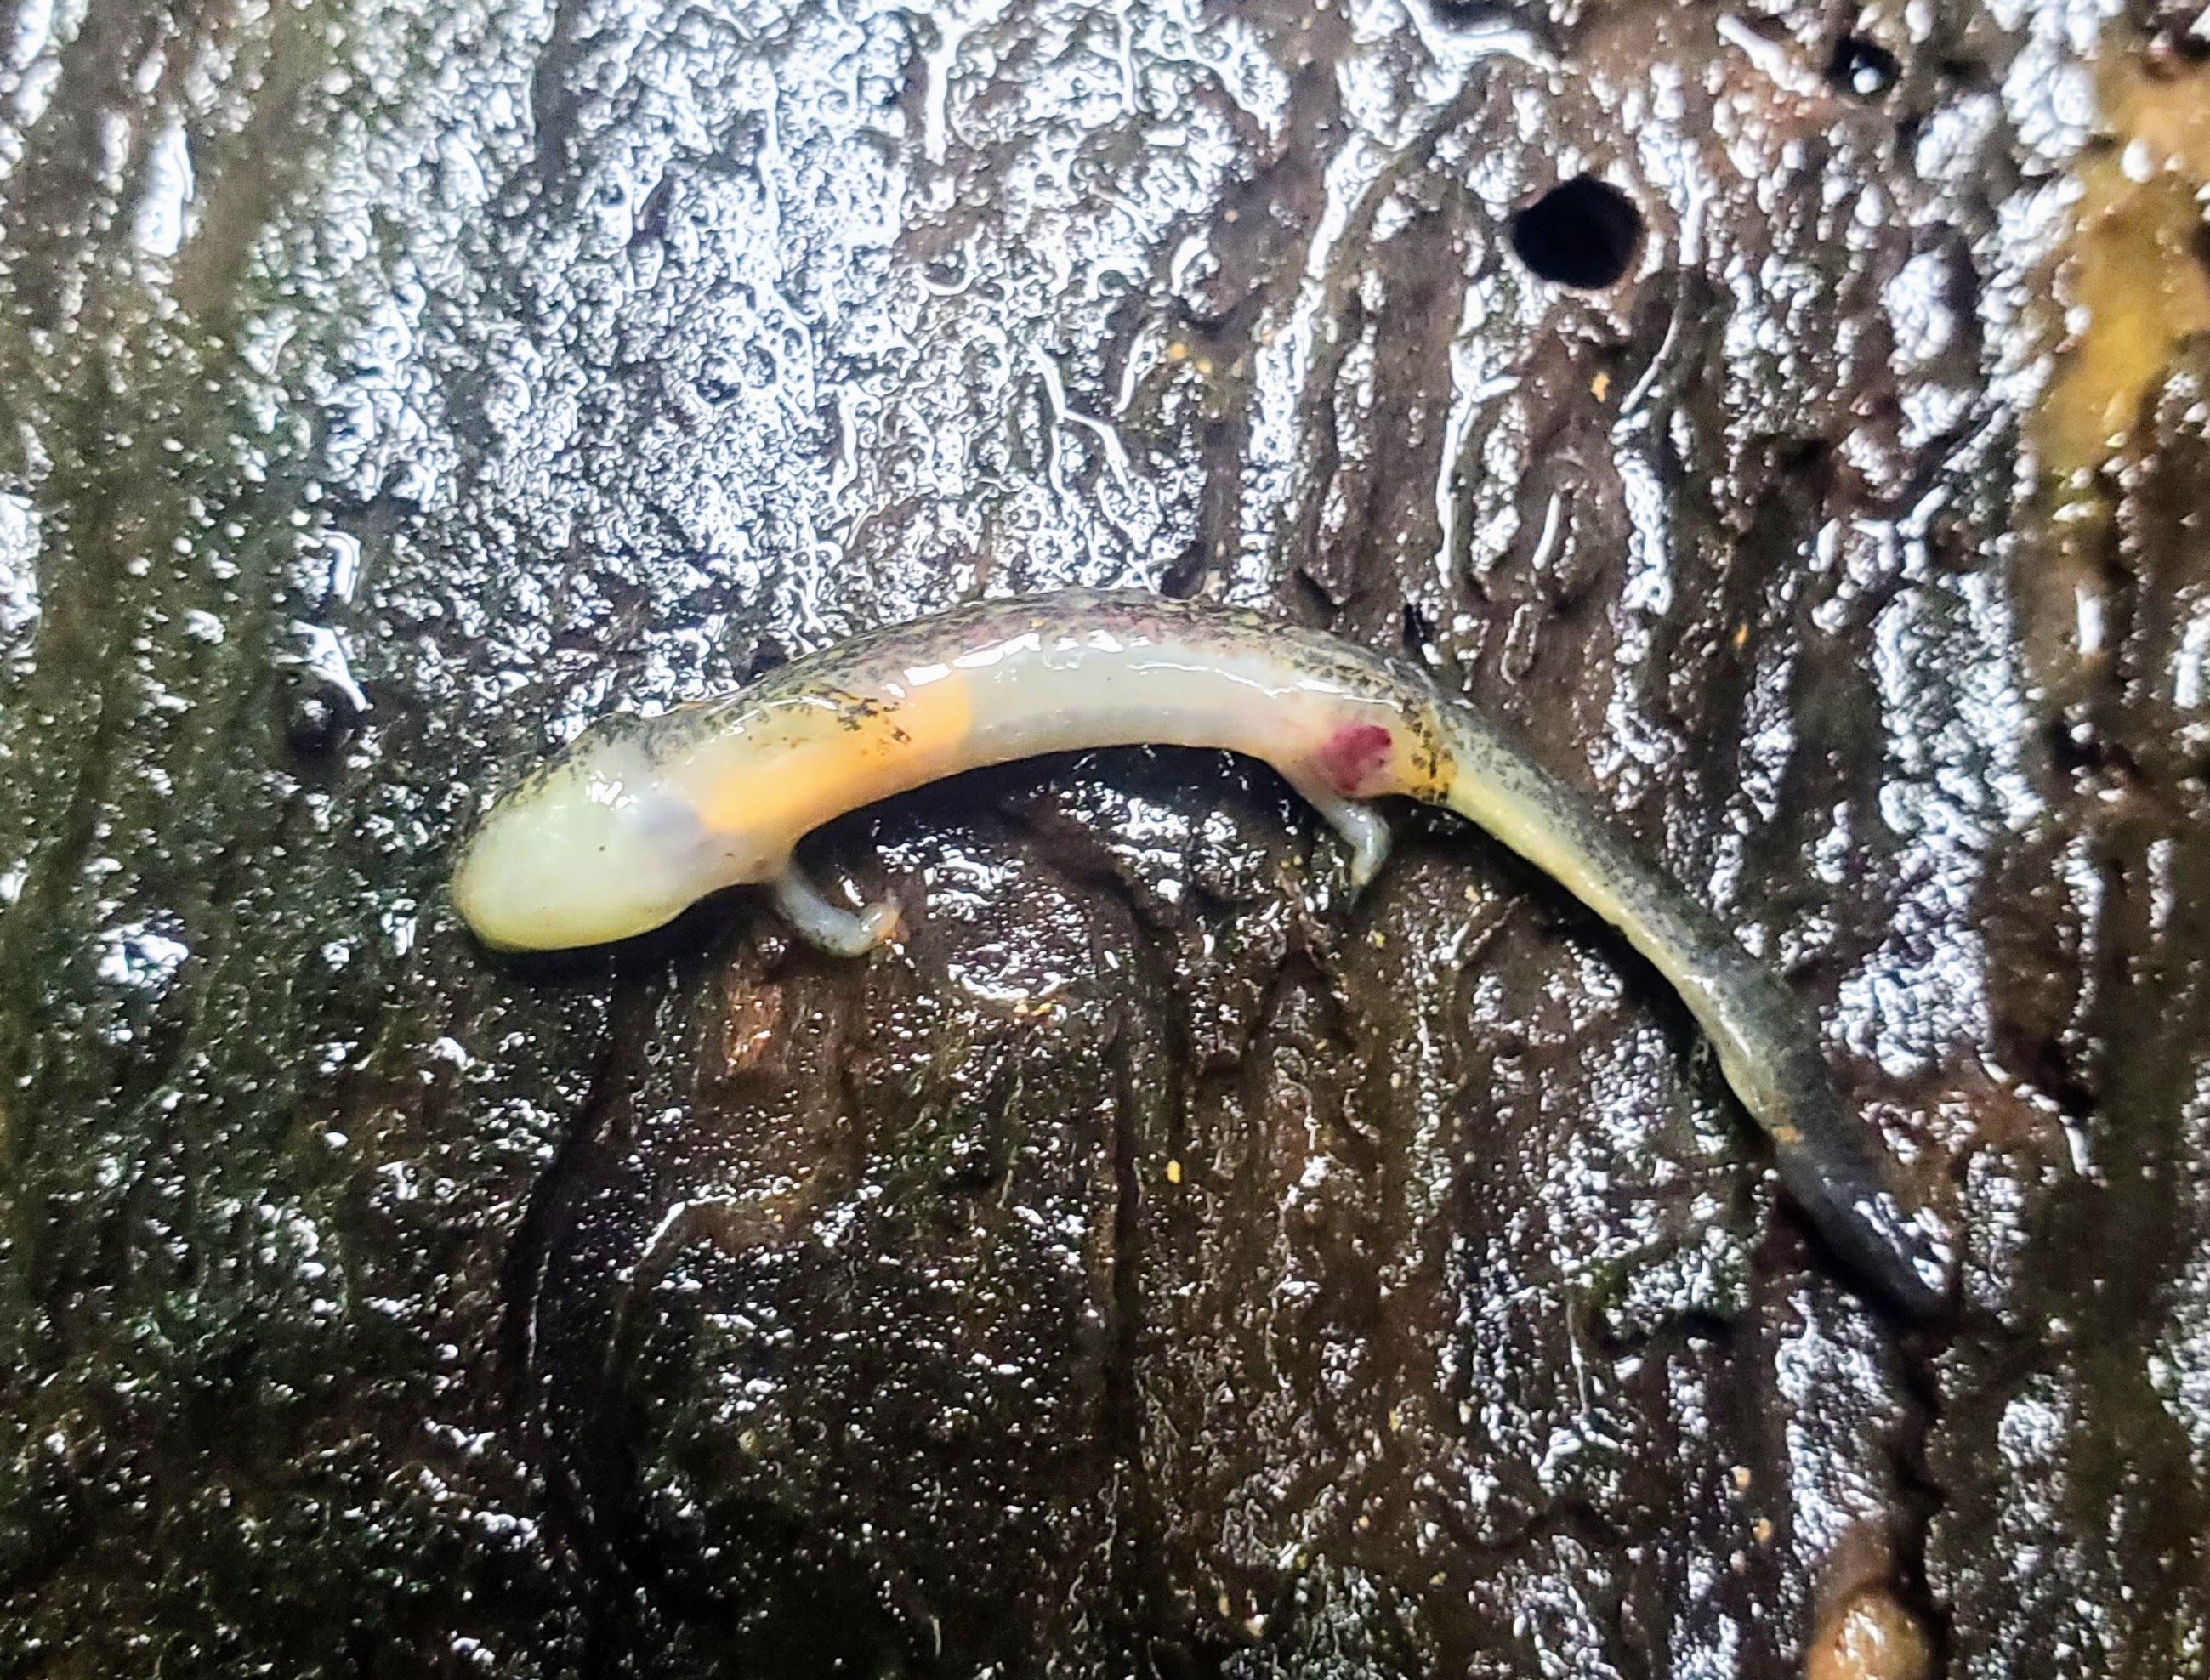
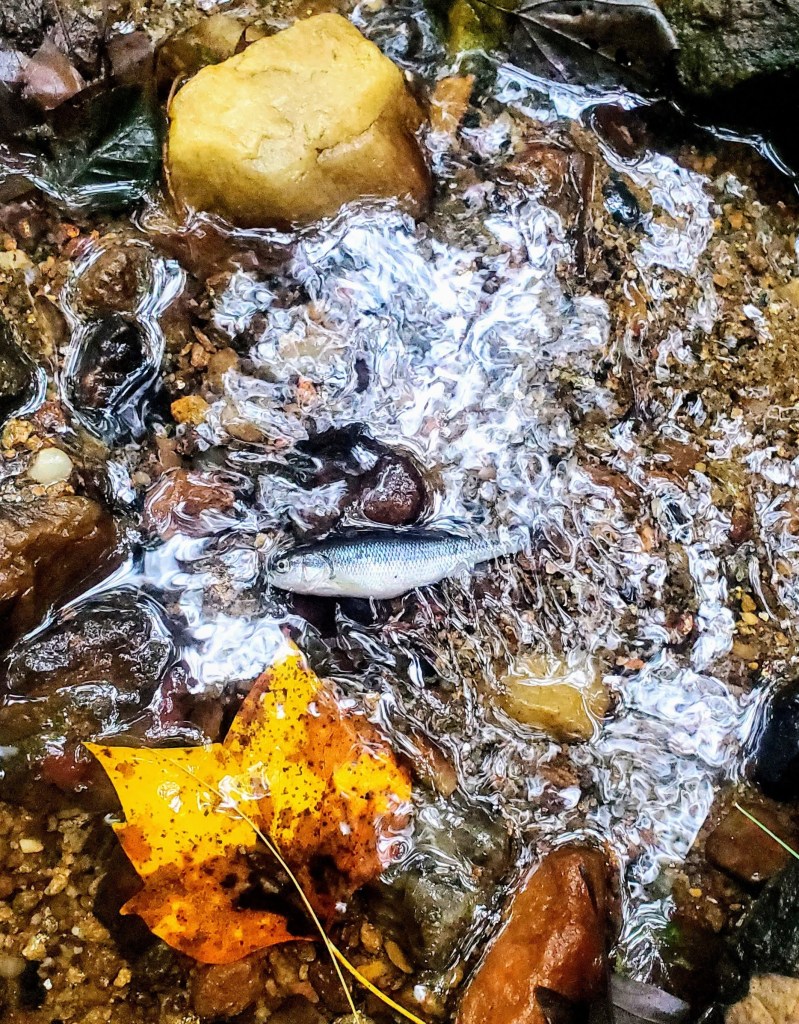
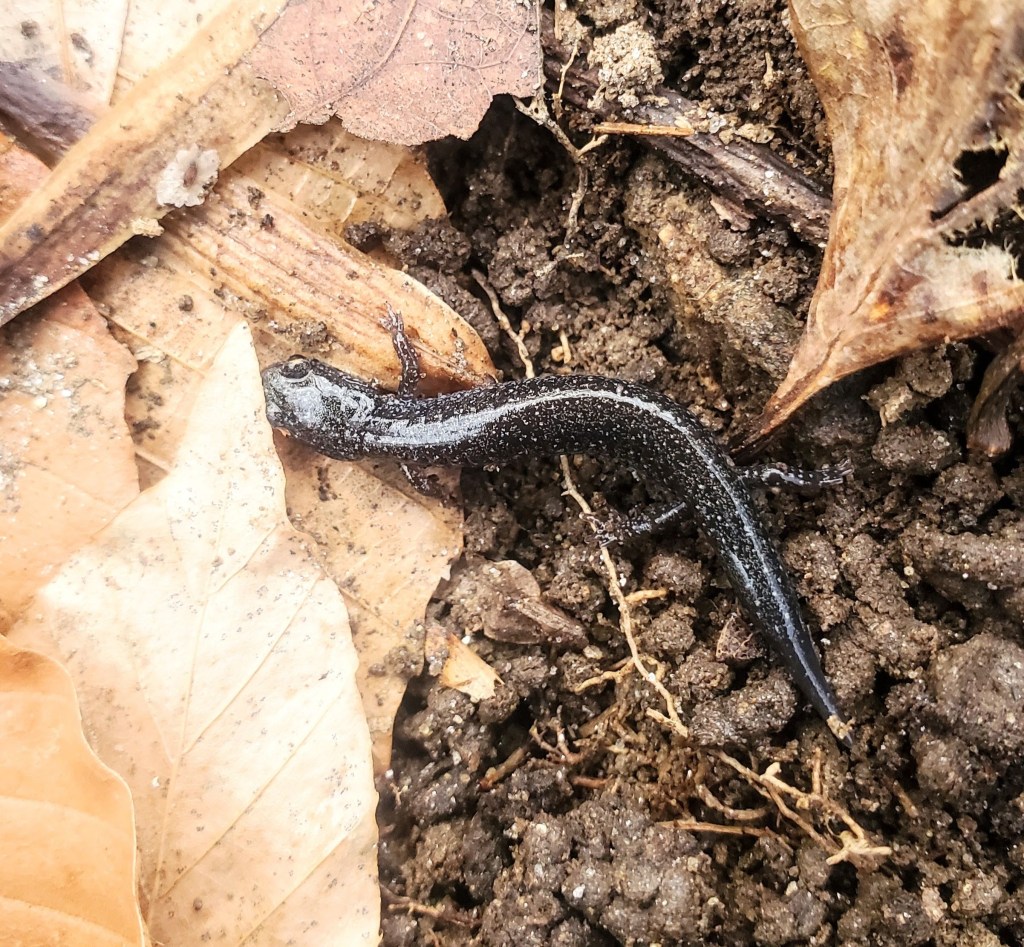
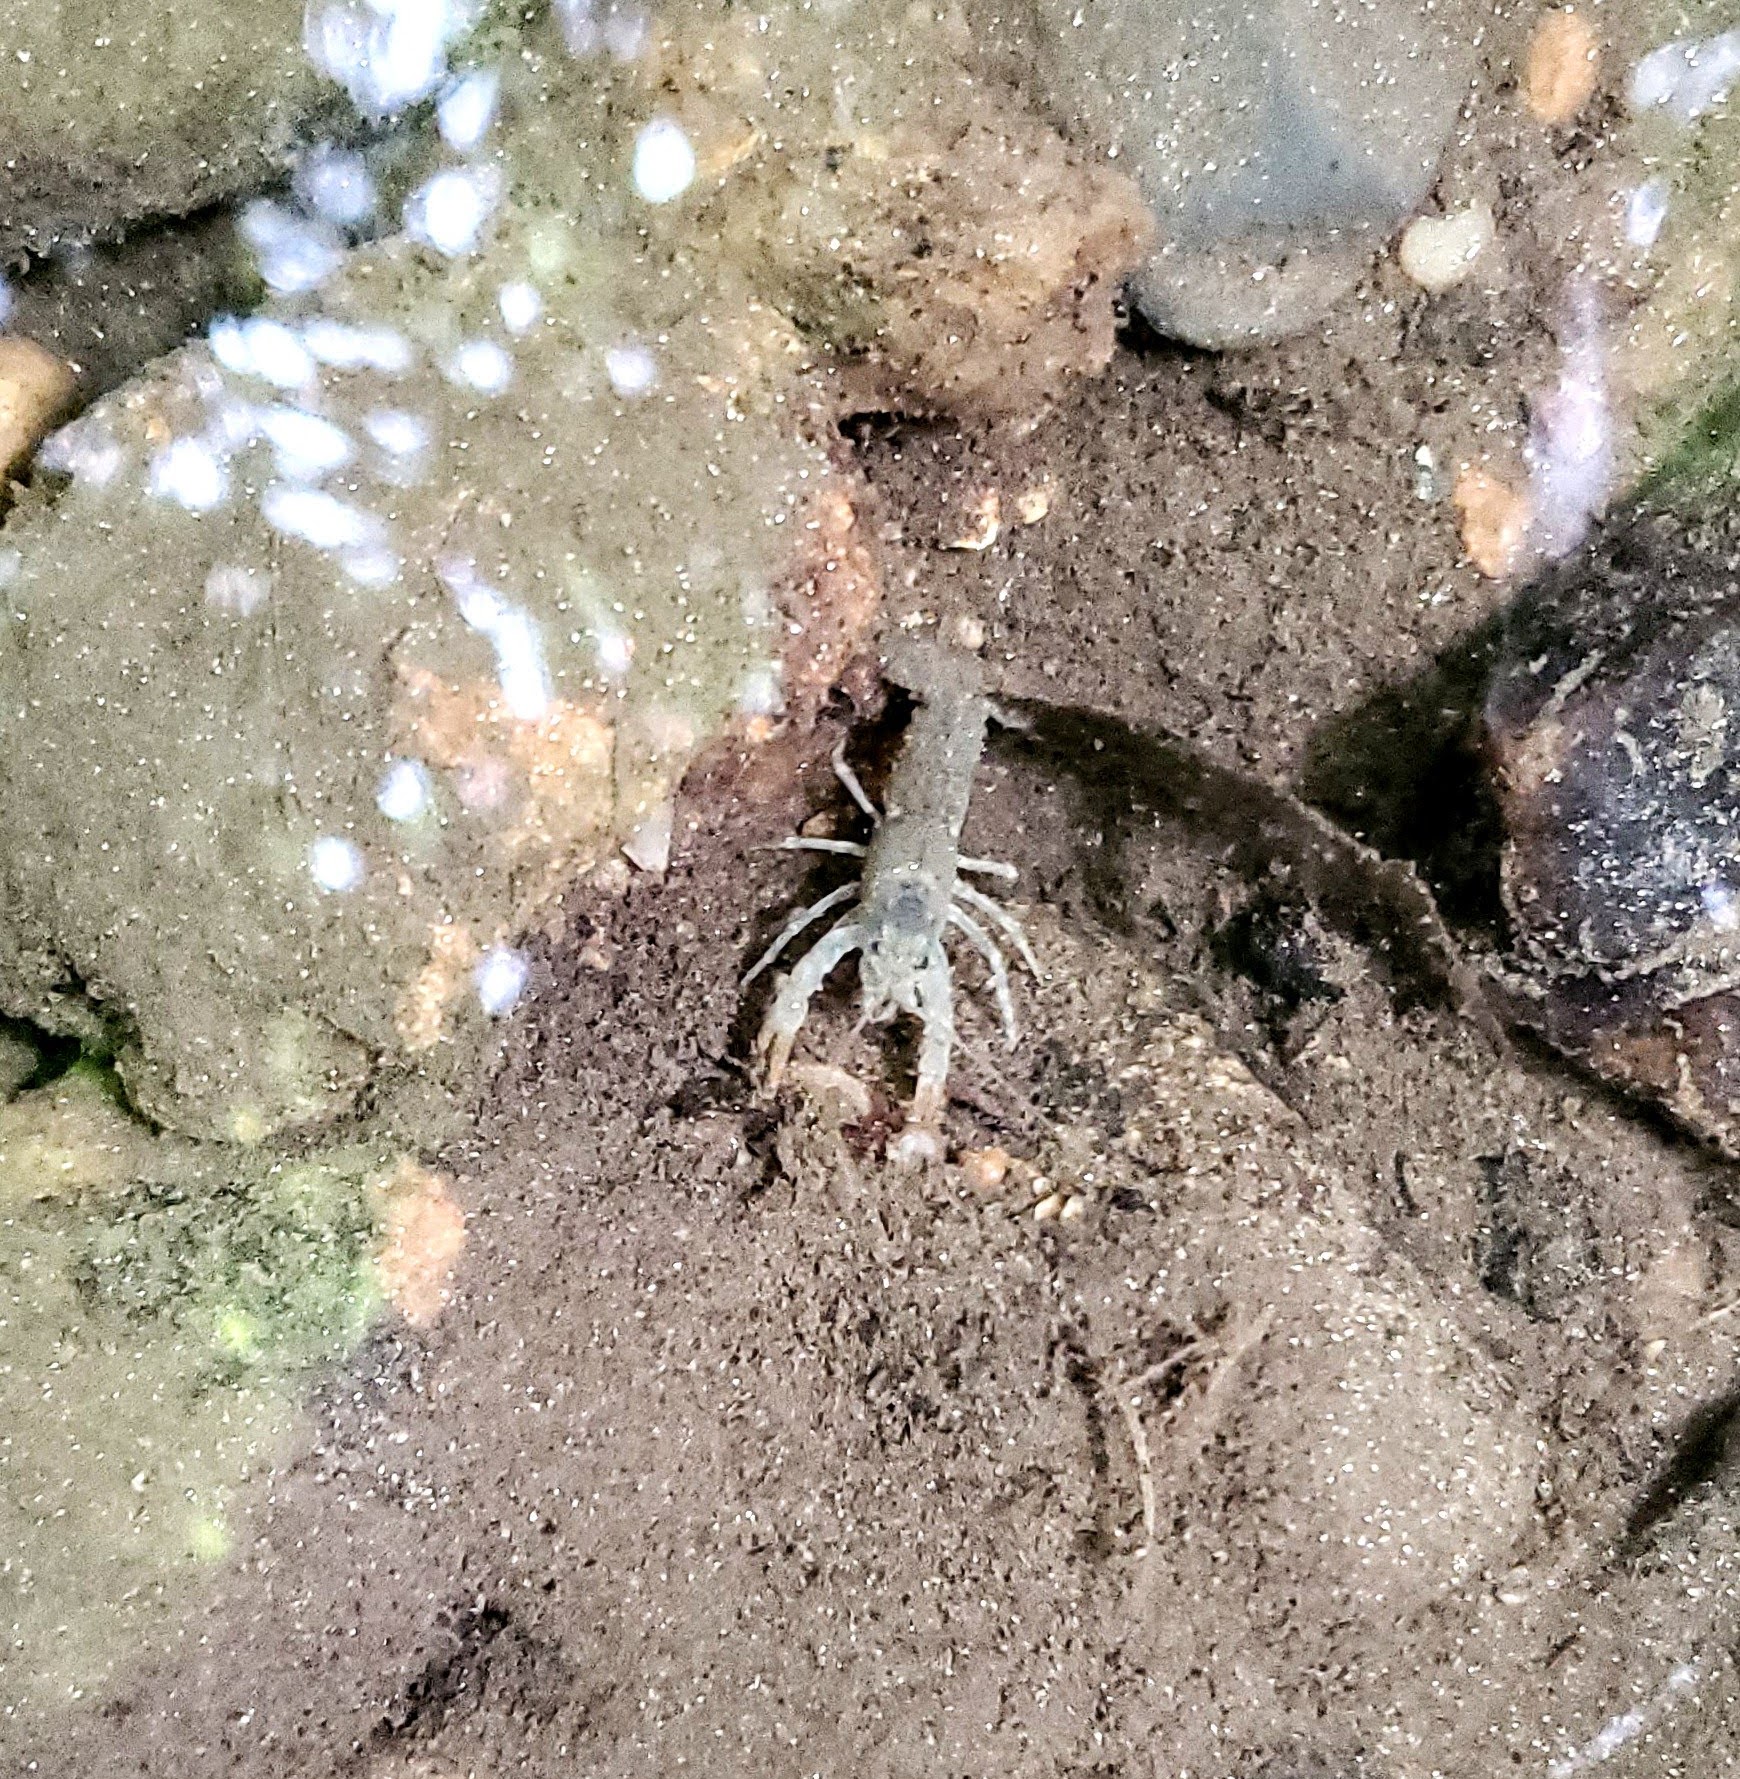
The Northwest Branch of the Anacostia River is surrounded by a surprisingly extensive riparian buffer strip for most of its length. This steep and forested corridor of undeveloped land protects the river from land-use impacts while protecting the surrounding developed land from flooding. The floodplains, hillslopes, and valleys are host to diverse forms of urban wildlife, here are some I have encountered while studying the river and its branches.
Forest canopy cover in the Anacostia River Watershed (both Northwest and Northeast Branches). Green corridors line the streams and their tributaries throughout the DC metro region.
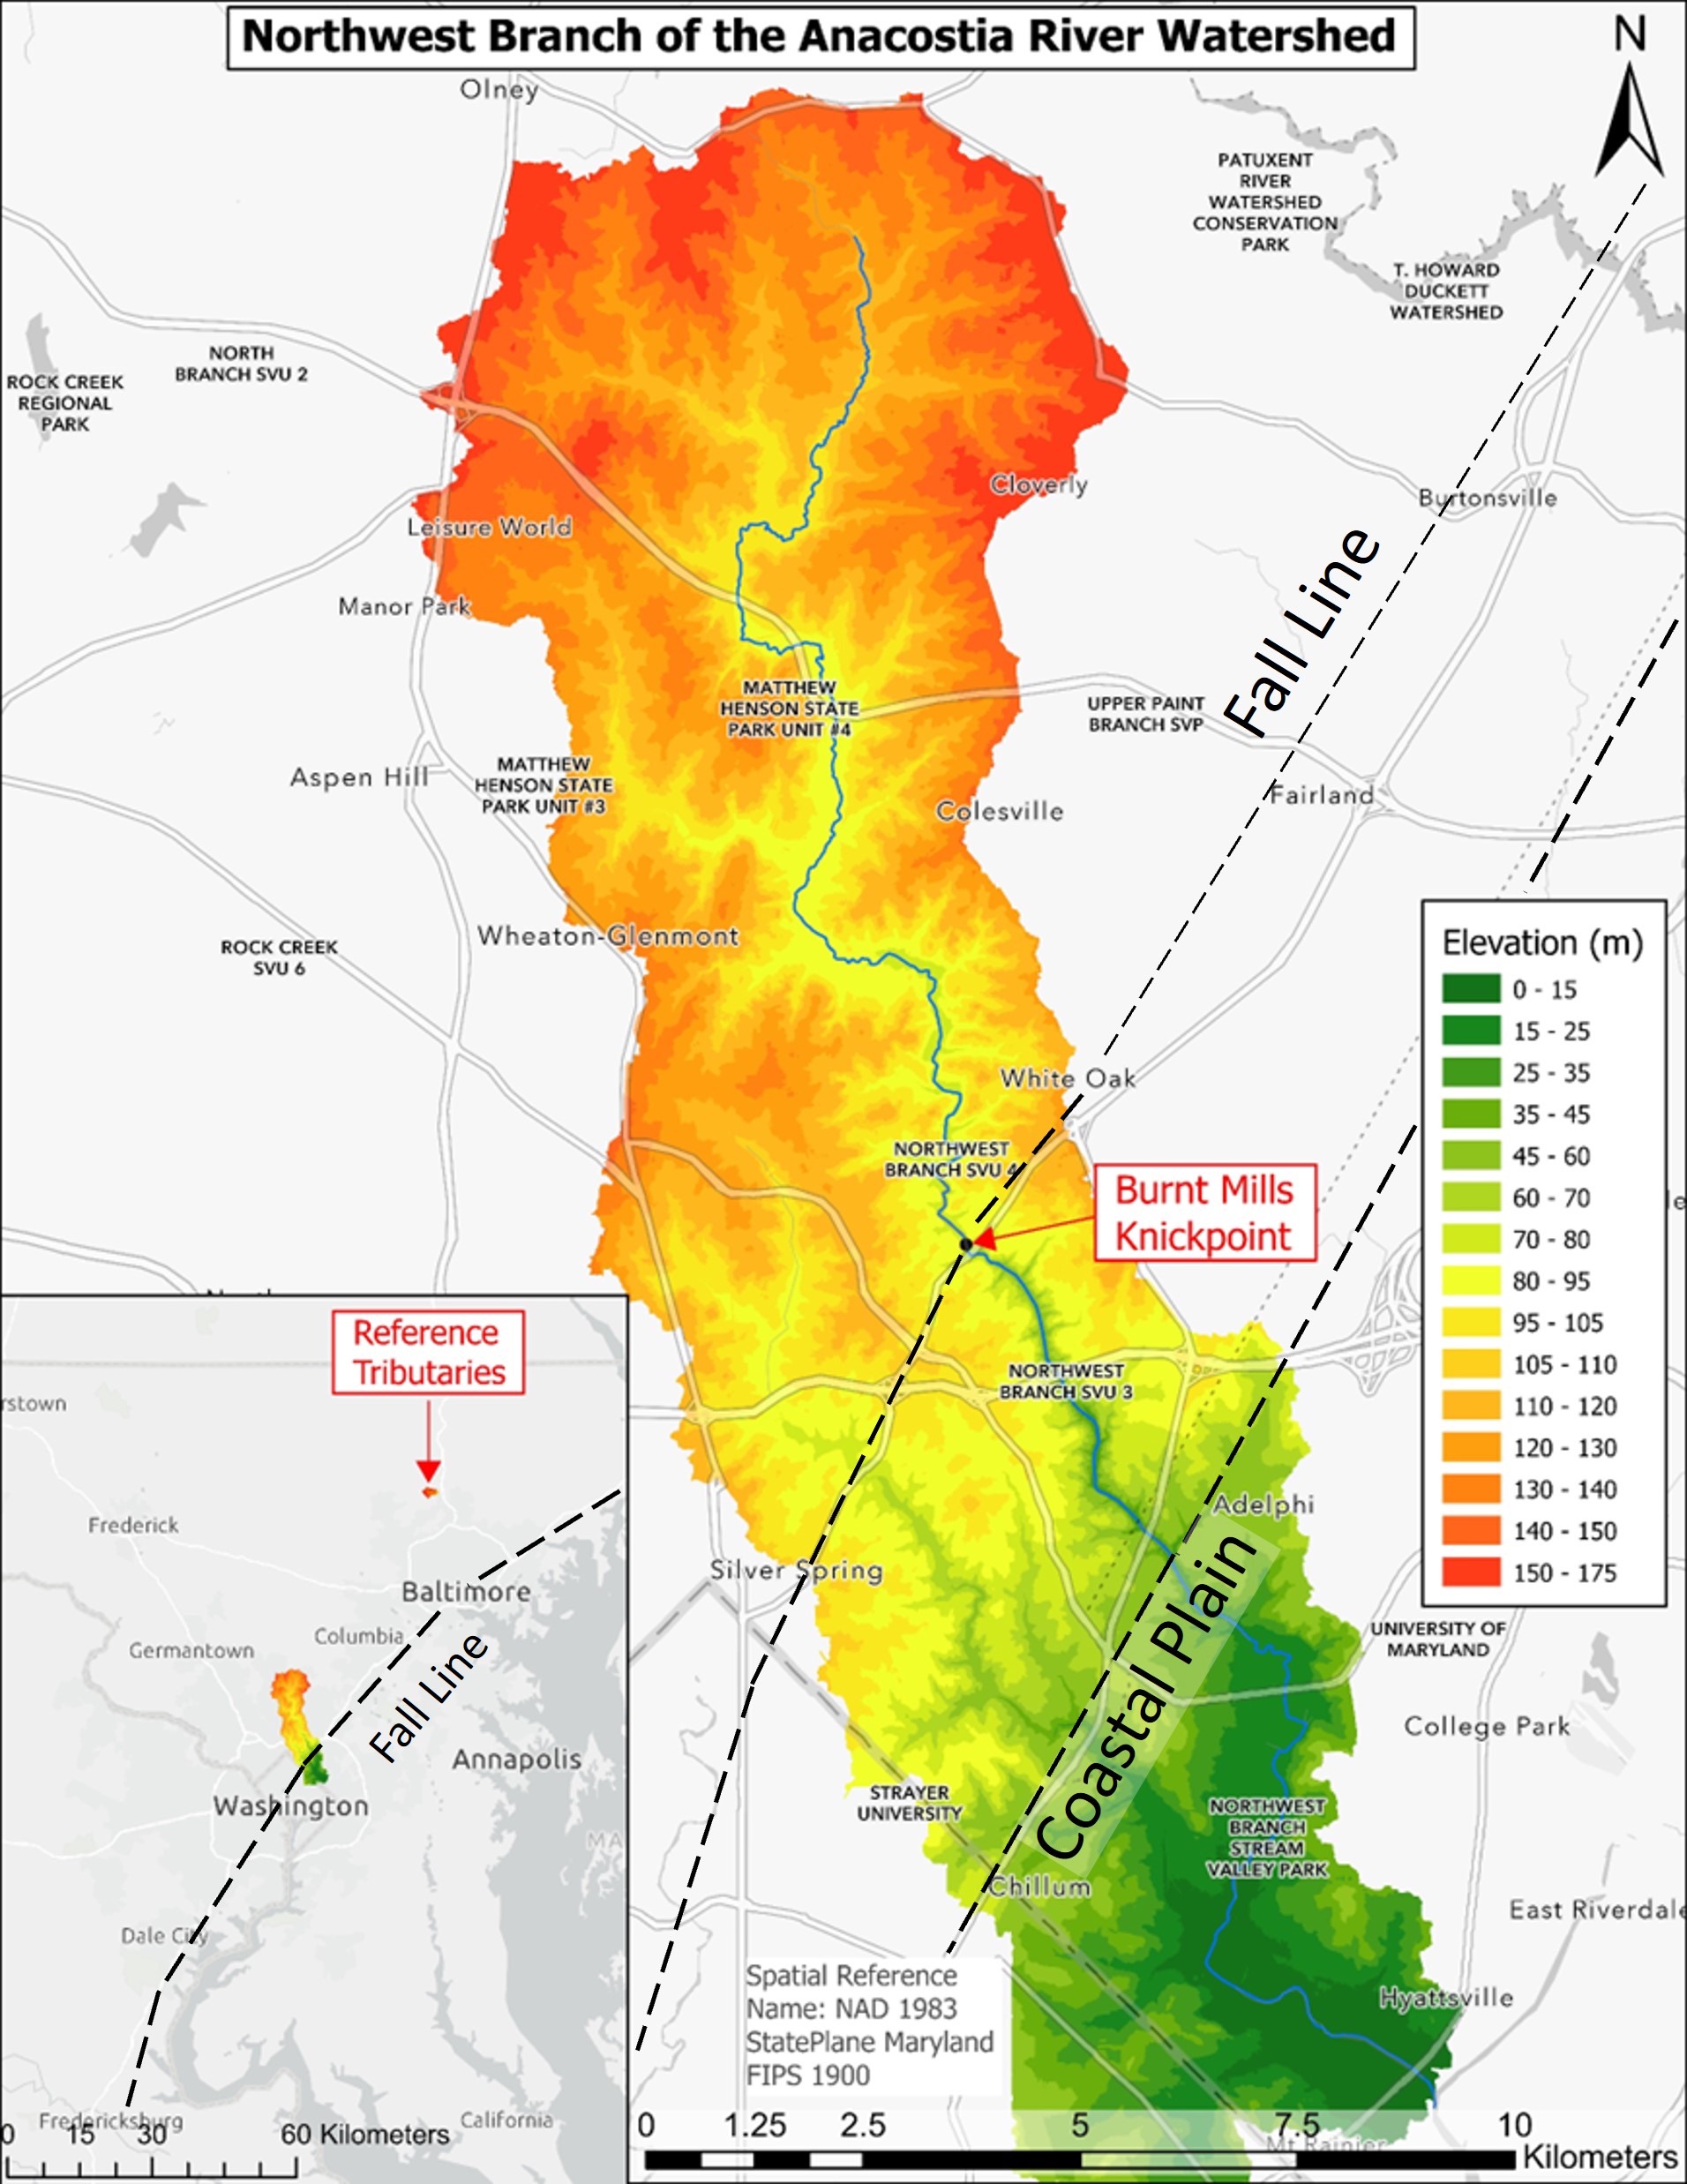
The Northwest Branch of the Anacostia River is an urbanized stream in Montgomery and Prince George’s Counties, Maryland, draining 135.5 square kilometers at its confluence with the Northeast Branch of the Anacostia River. It straddles the Atlantic Fall Zone, which marks the transition from Coastal Plain sediment to crystalline Piedmont bedrock. In Mid-Atlantic streams the Fall Zone is present as a series of knickpoints migrating headward with post-Pleistocene sea level rise and glacial isostatic adjustment (Bierman, 2015; Pico et al., 2019). The active knickpoint in the Northwest Branch has propagated approximately 5 kilometers upstream of the Coastal Plain boundary into the portion of the river incised into Piedmont bedrock, at a site named Burnt Mills. There is approximately 20-40 meters of channel incision below the knickpoint. The river is incised into Piedmont alluvium upstream of Burnt Mills up to its head in Sandy Springs, MD.
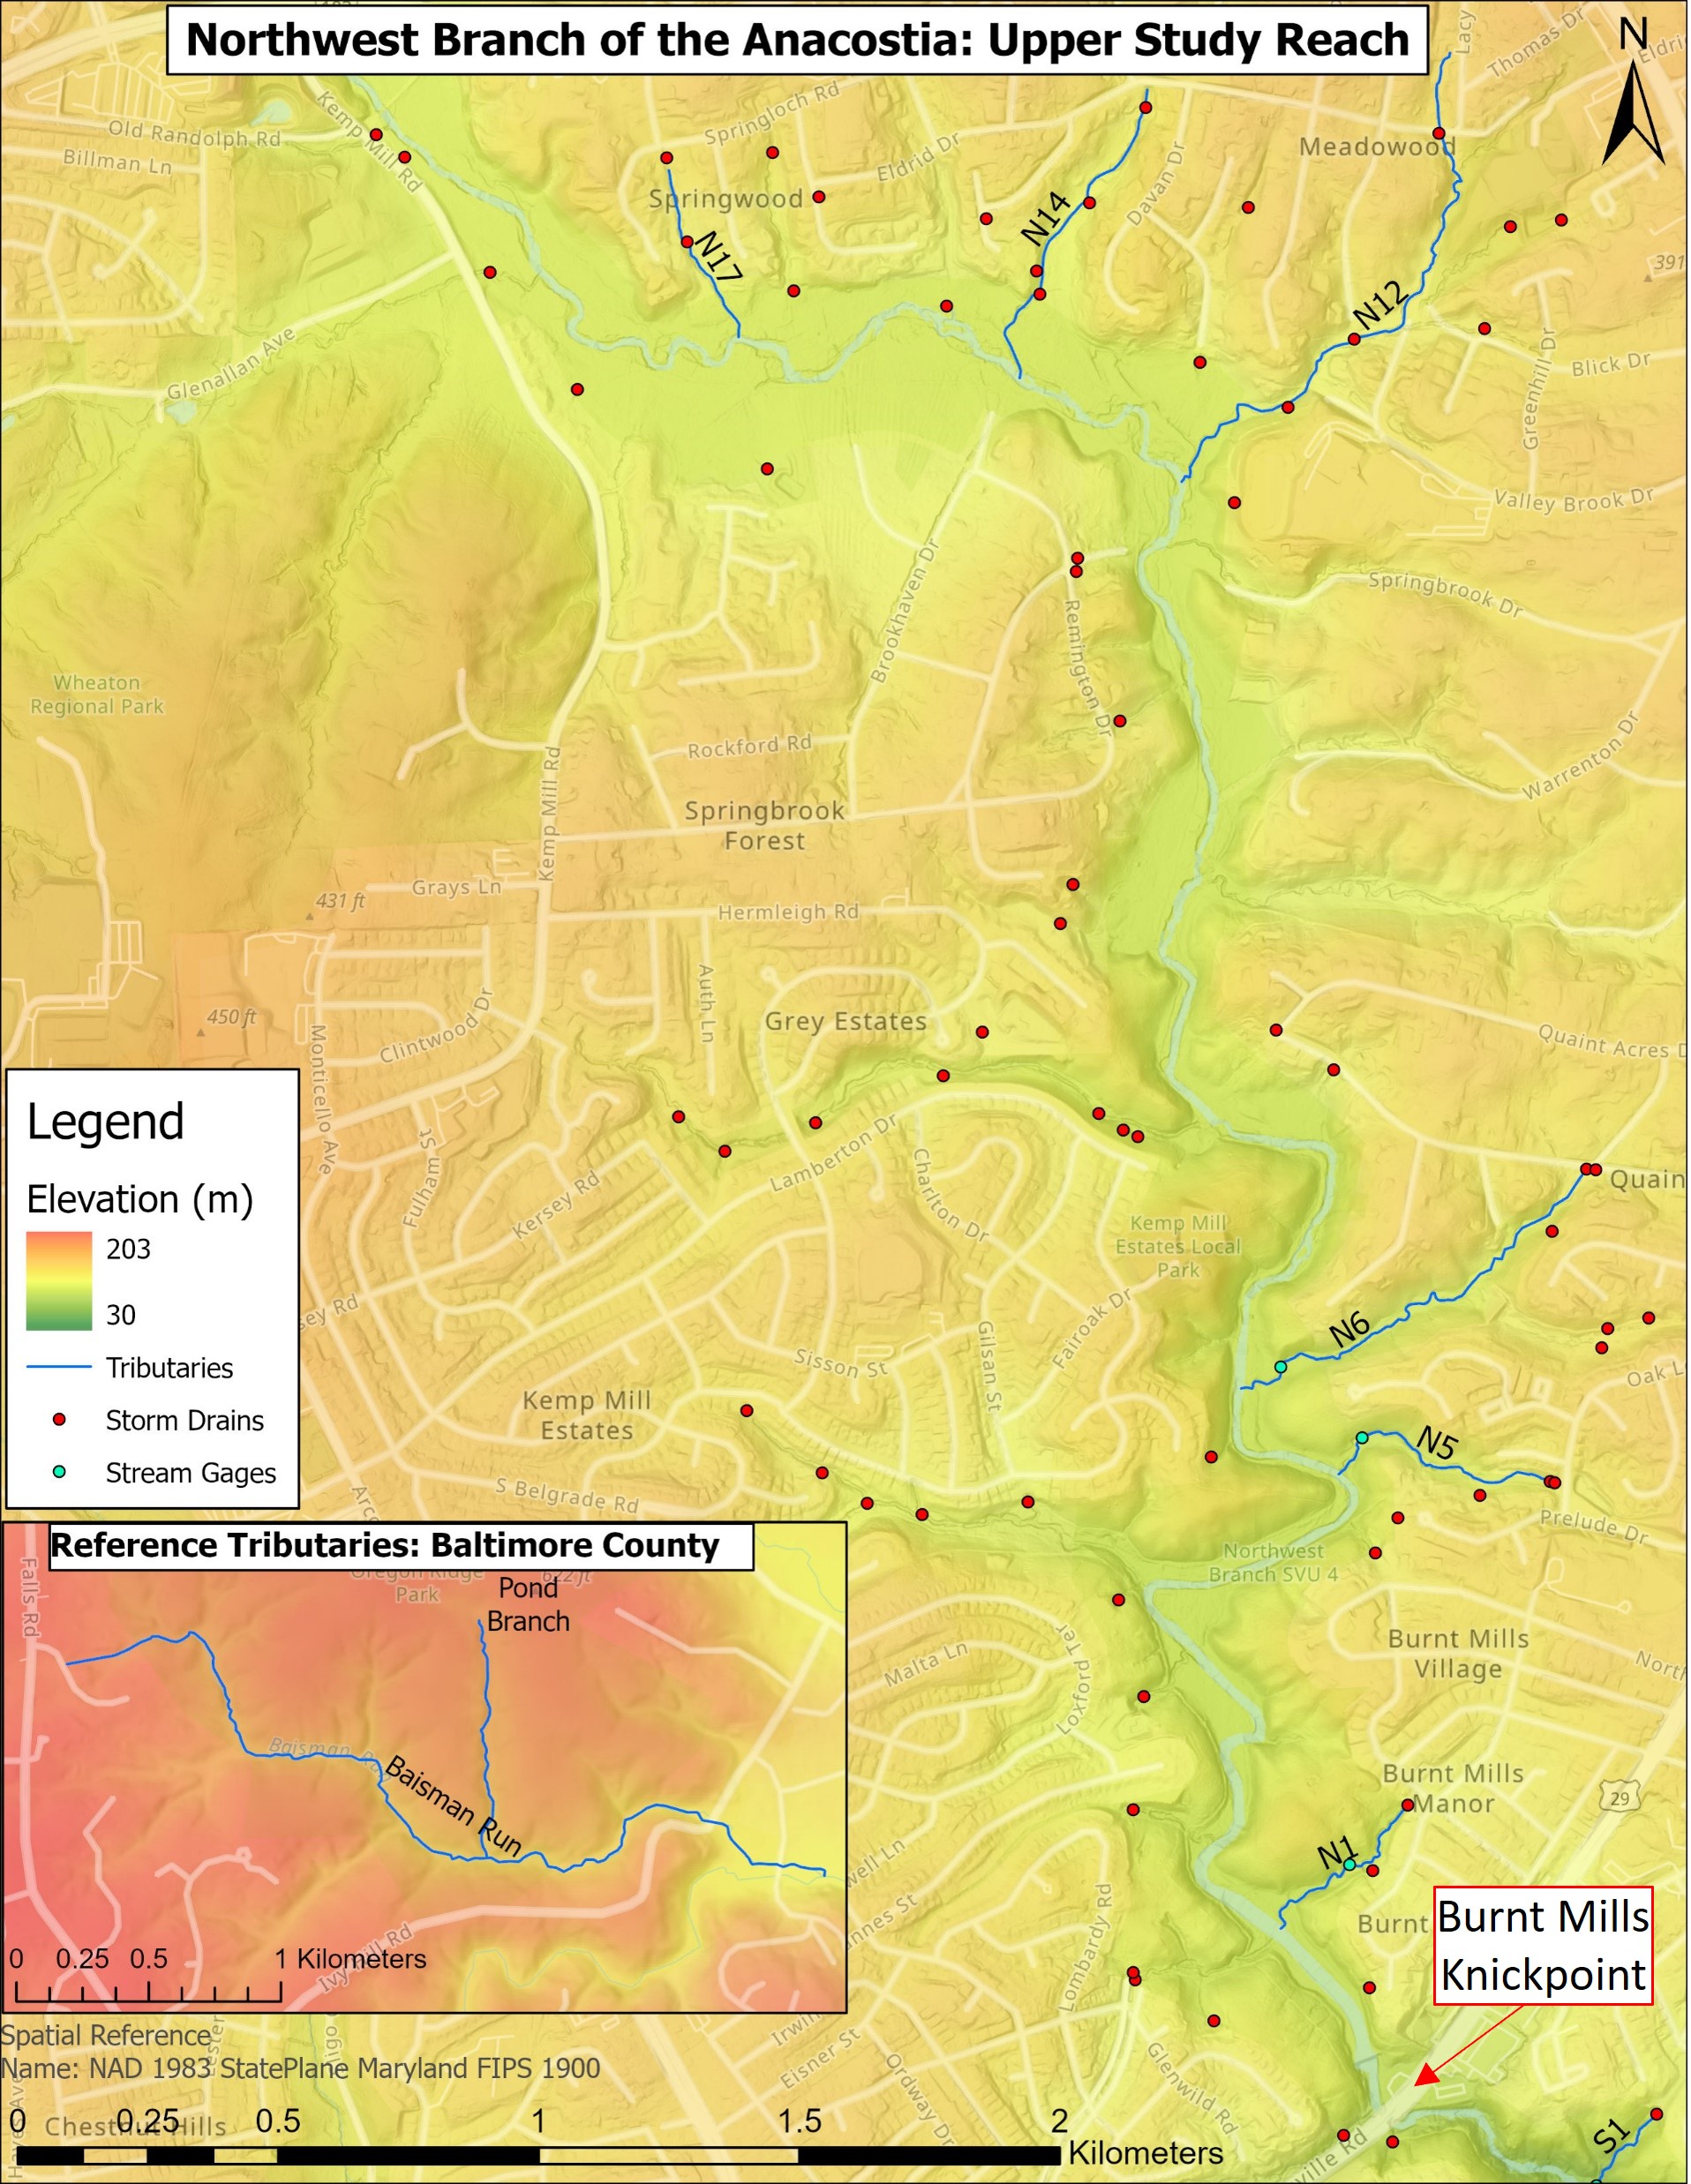
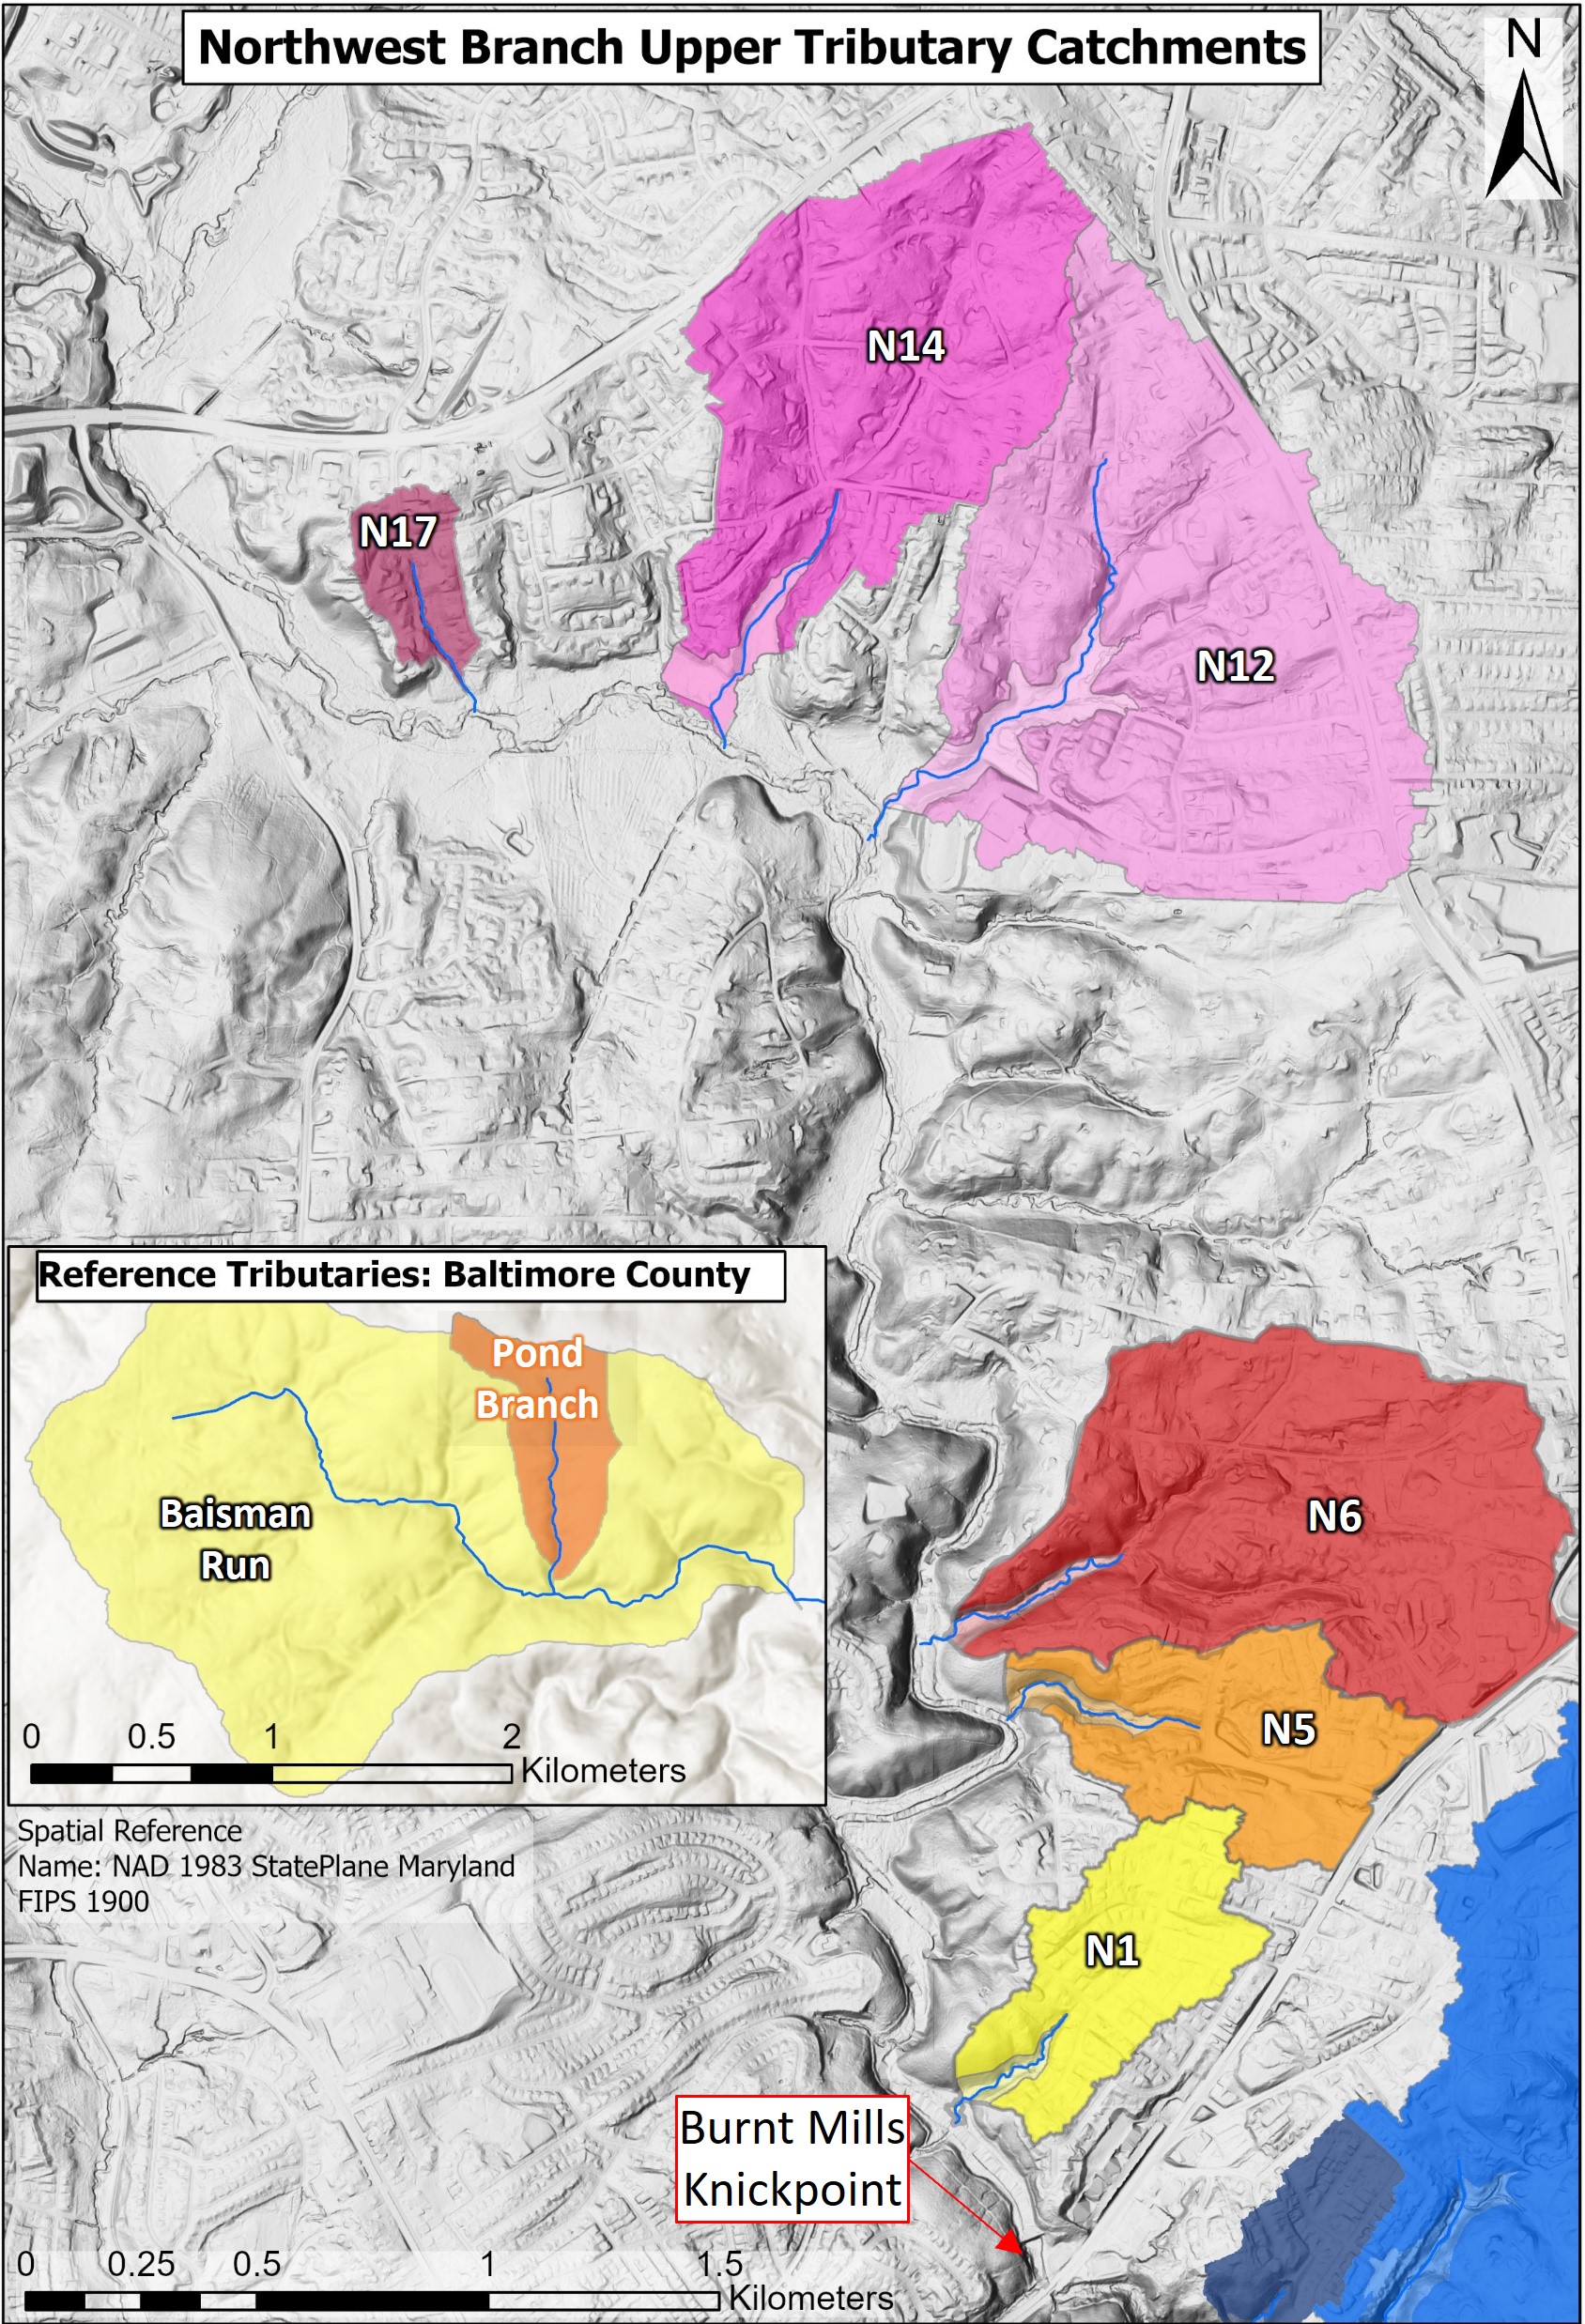
LiDAR-derived elevation map (Sanborn, 2021) of the Northwest Branch of the Anacostia River Watershed with the study reach and the knickpoint at Burnt Mills indicated. The Burnt Mills knickpoint is located along the Fall Line, which splits the watershed. The inset map shows the forested reference tributaries located above the Fall line in the Gunpowder River Basin in Baltimore County.
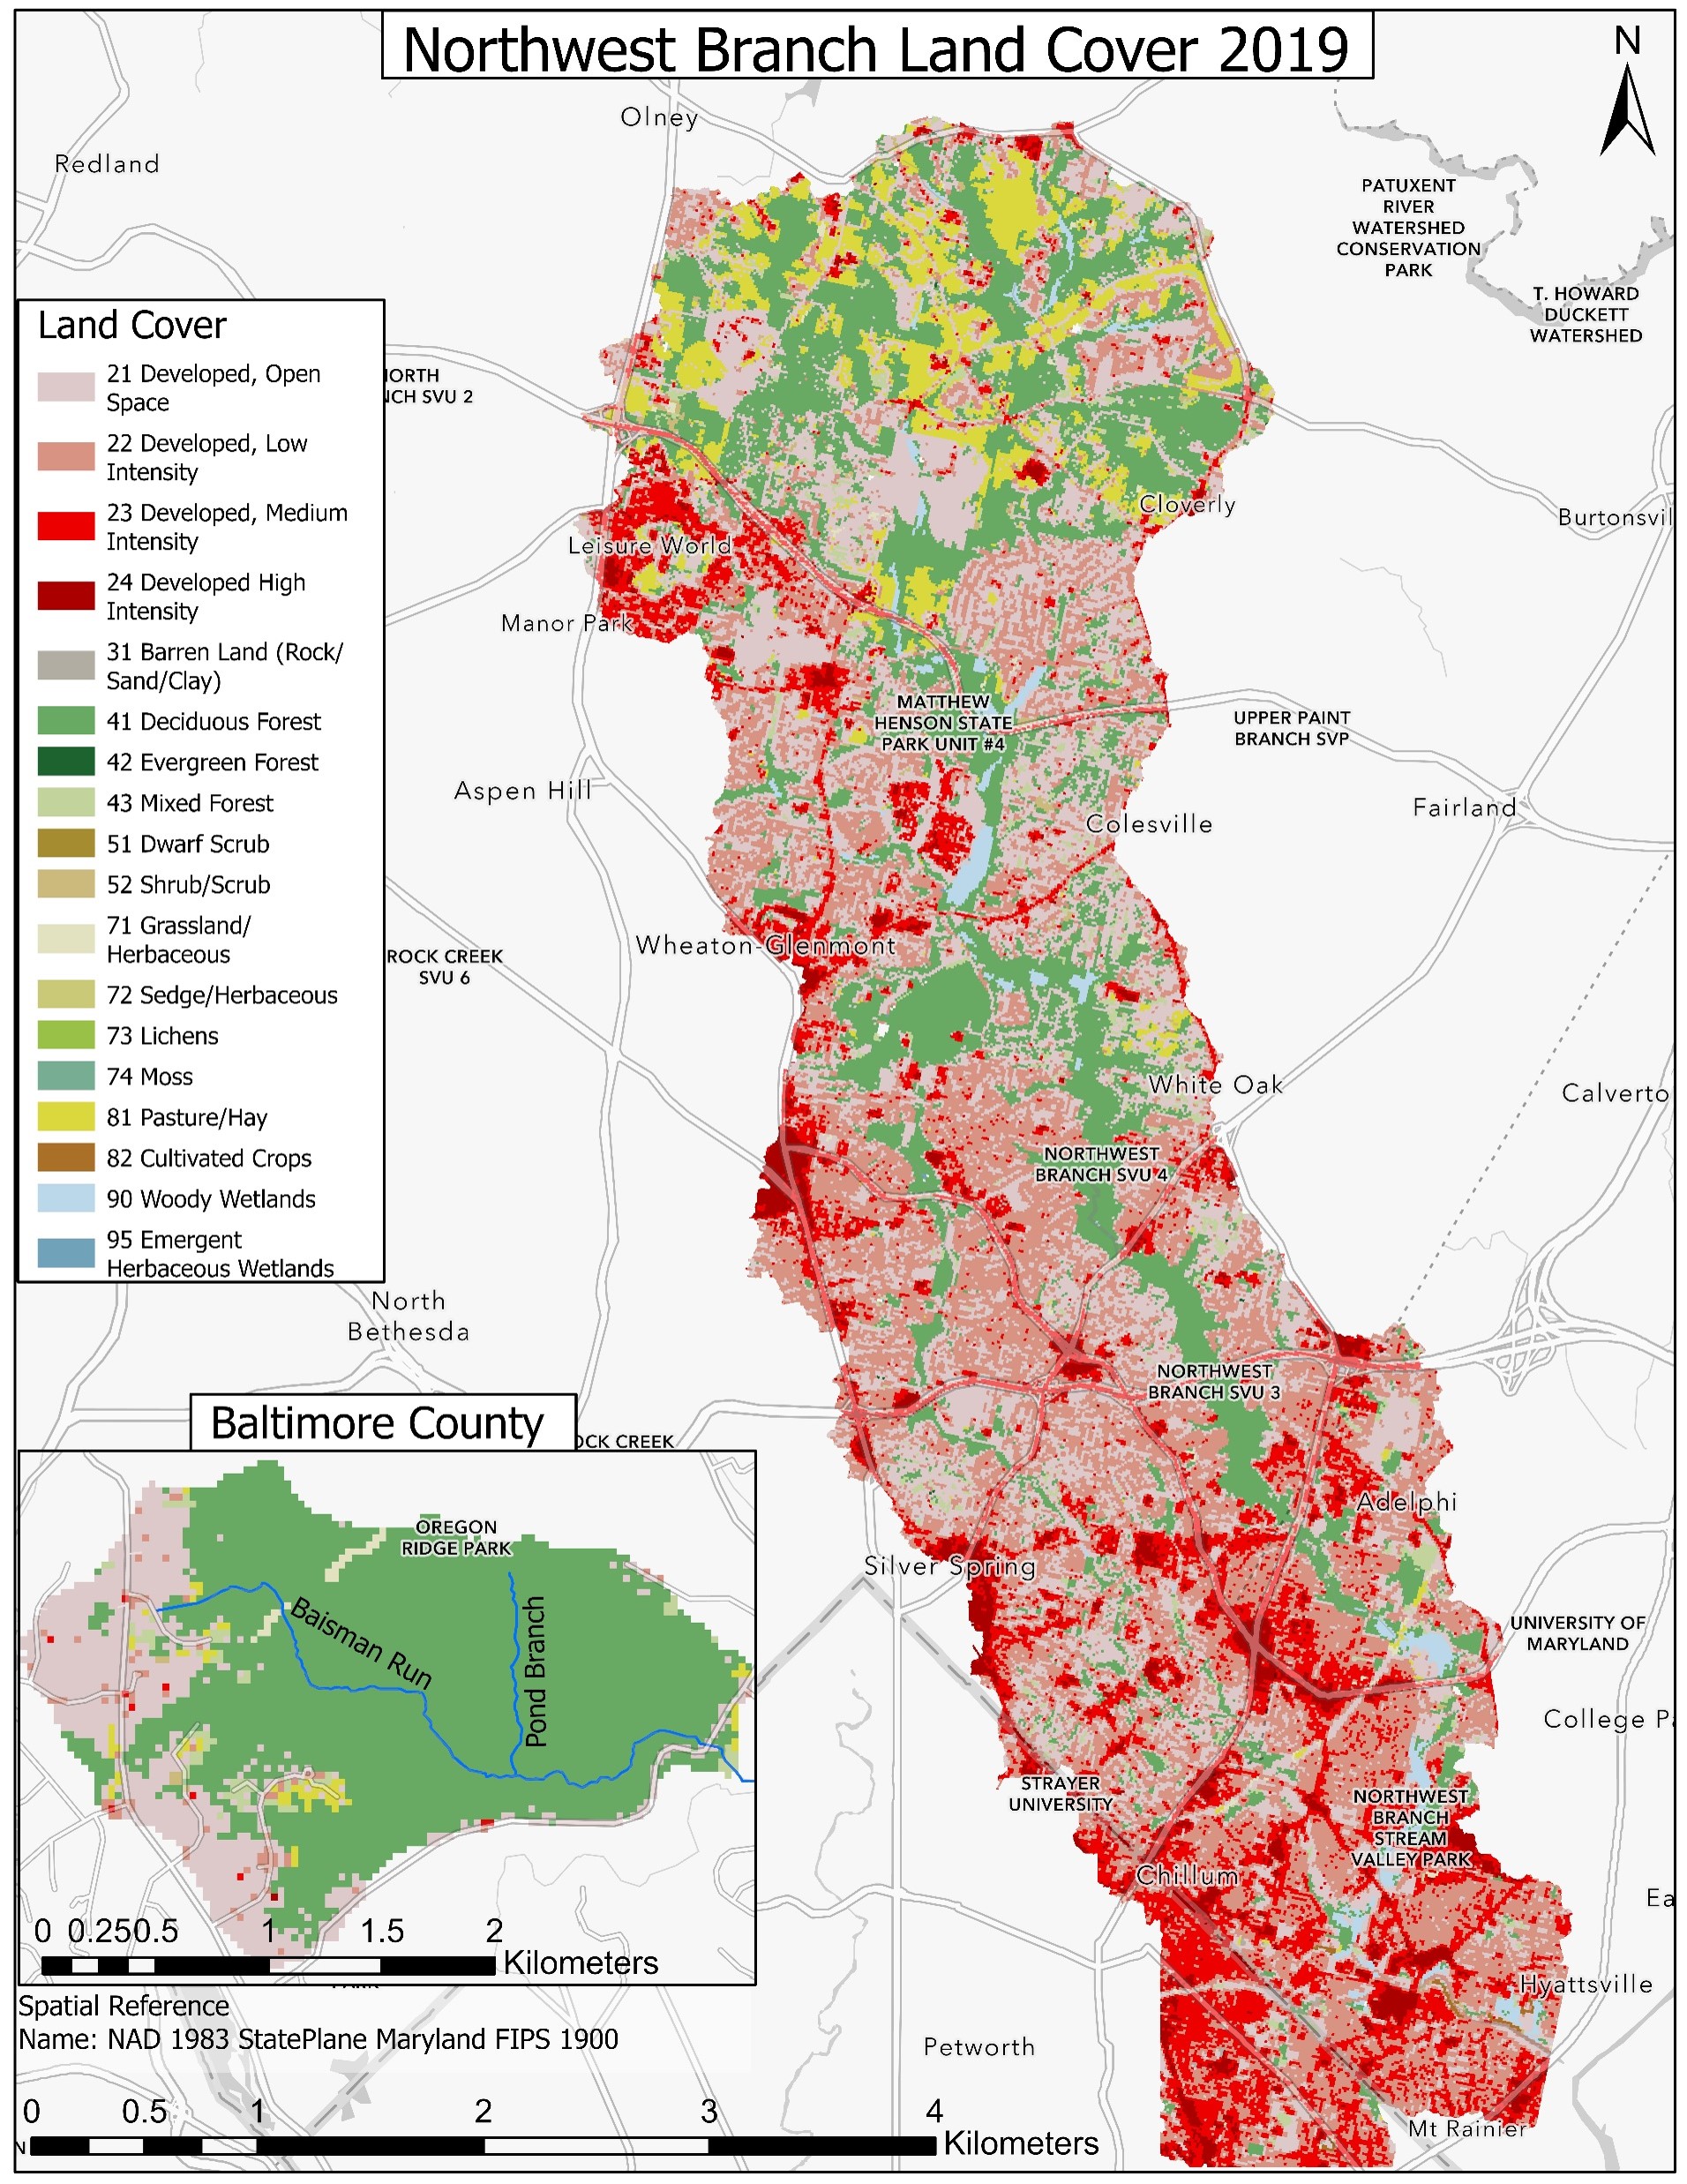
Land cover in the Northwest Branch and Baisman Run watersheds. Urban development in the watershed increases to the south towards Washington D.C. Land cover in the study reach is primarily low-medium intensity residential development in the upland portions and deciduous forest along the river. Baisman Run and Pond Branch watersheds are completely forested and undeveloped.
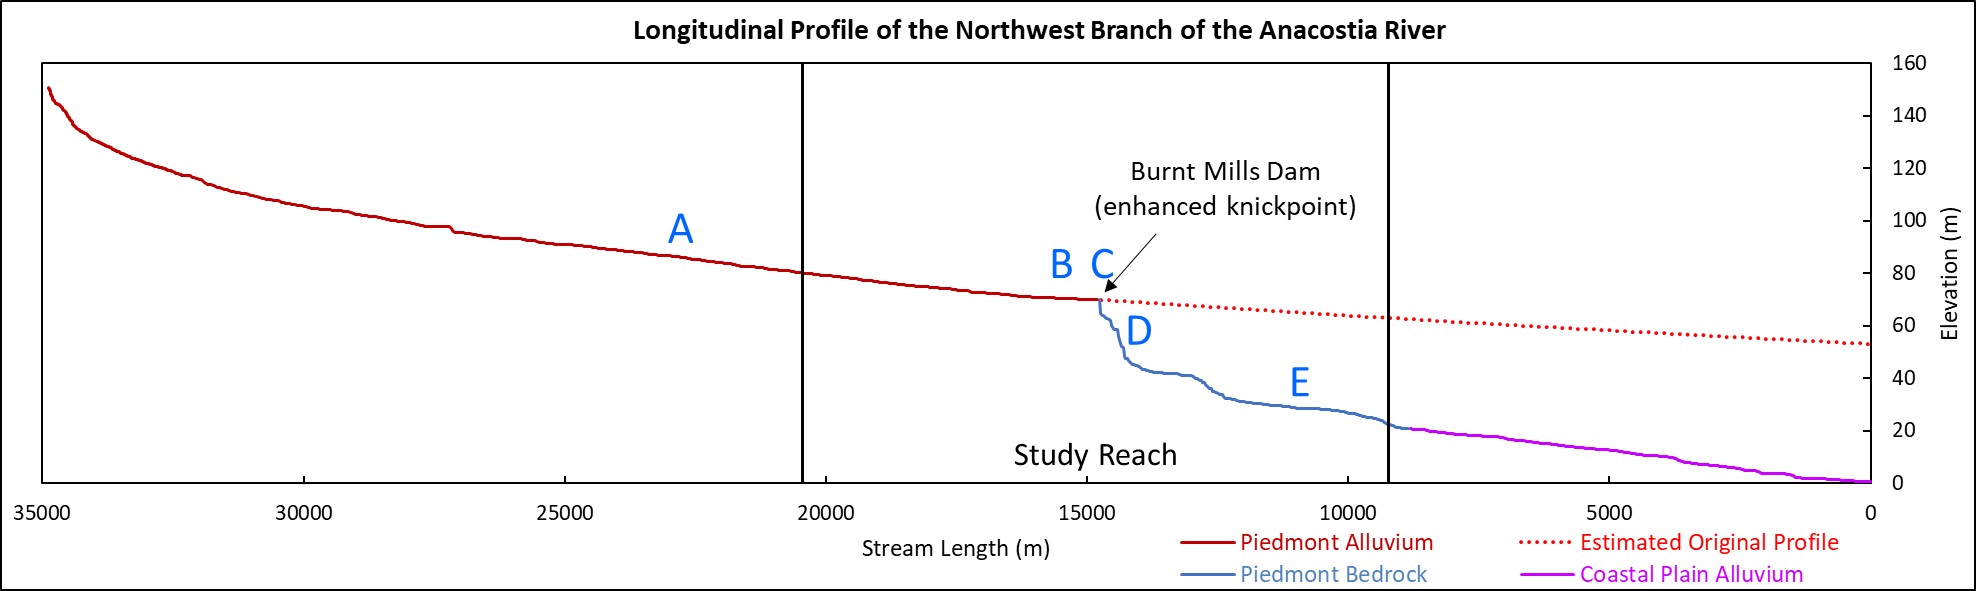
Longitudinal profile of the Northwest Branch from the drainage divide to the confluence with the Northeast Branch. The study reach, the Burnt Mills knickpoint (dam and torrent and gorge), and the three distinct geomorphic regions along the profile are indicated. An estimation of the longitudinal profile prior to knickpoint development is included. This estimation was created by projecting the stream length-gradient relationship in the Piedmont Alluvium region above the Burnt Mills knickpoint downstream to the mouth. Letters A-E mark the locations of photographs of the mainstem showing geomorphological changes.
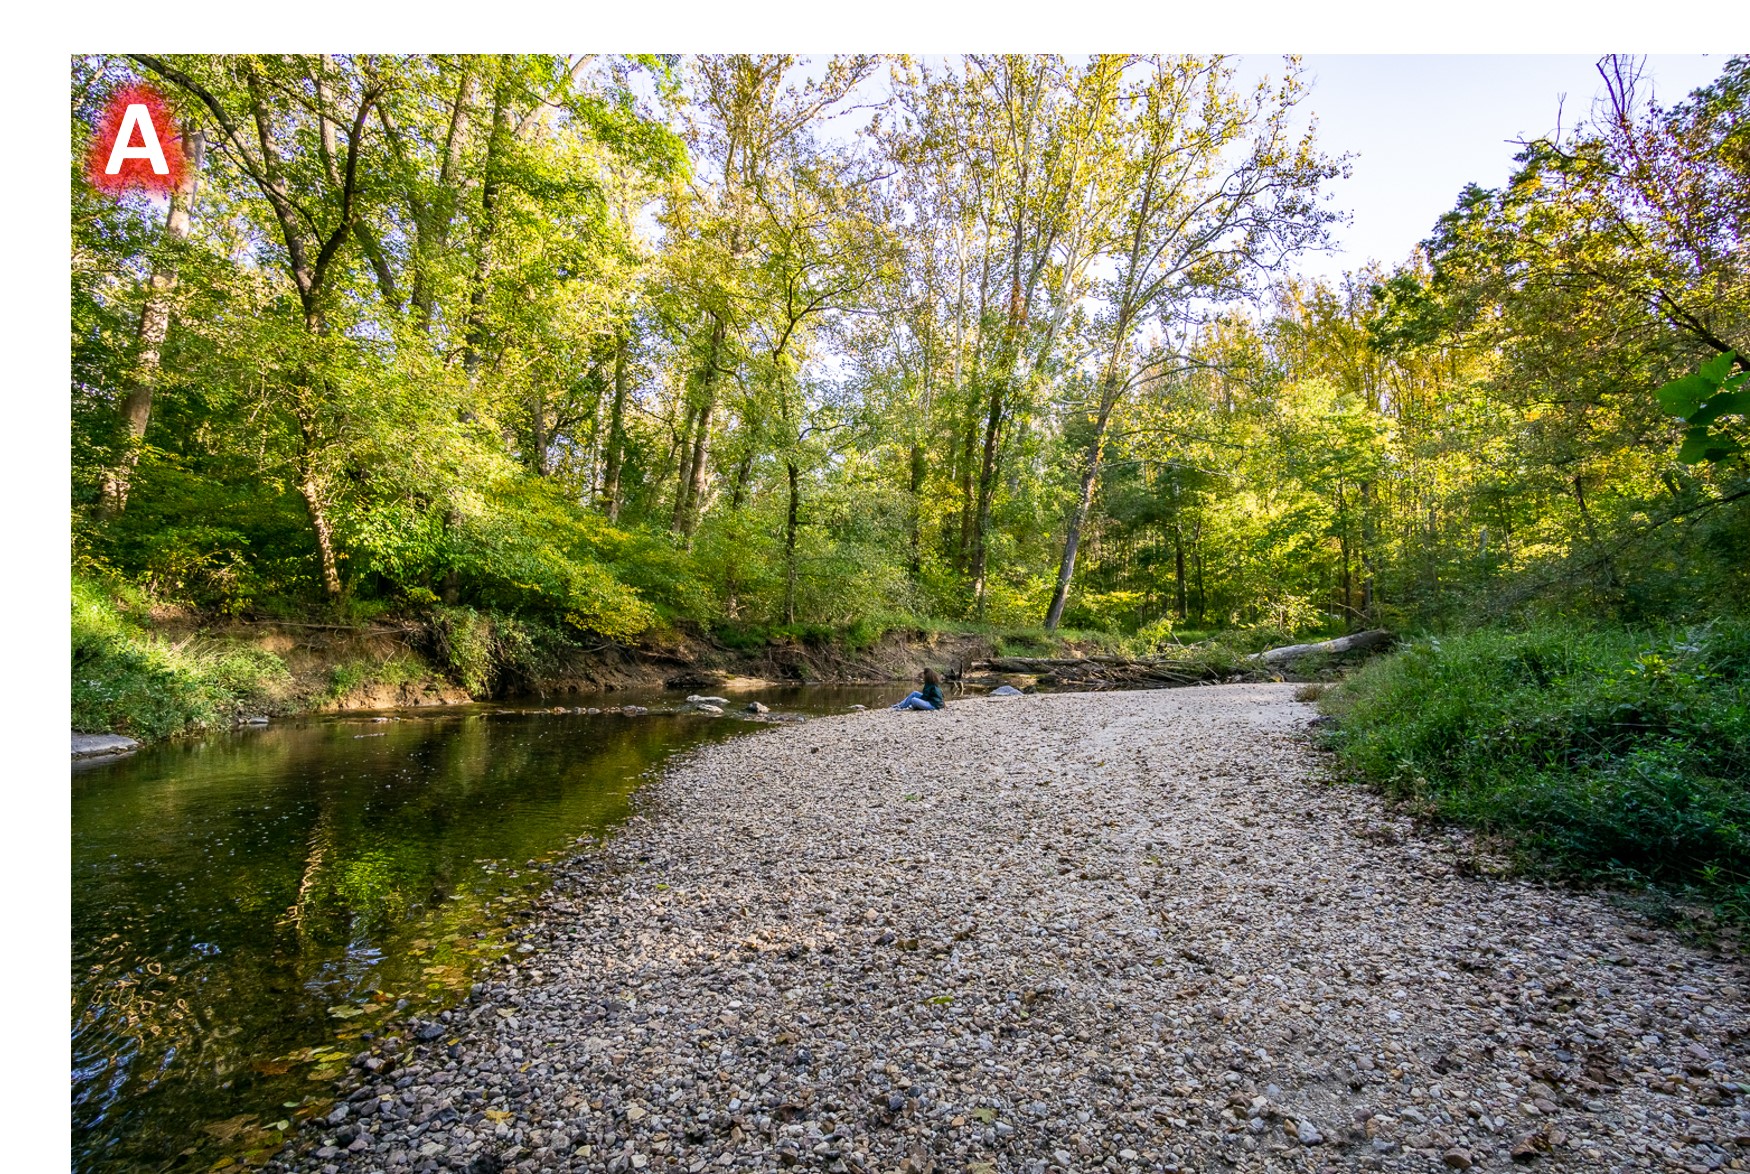
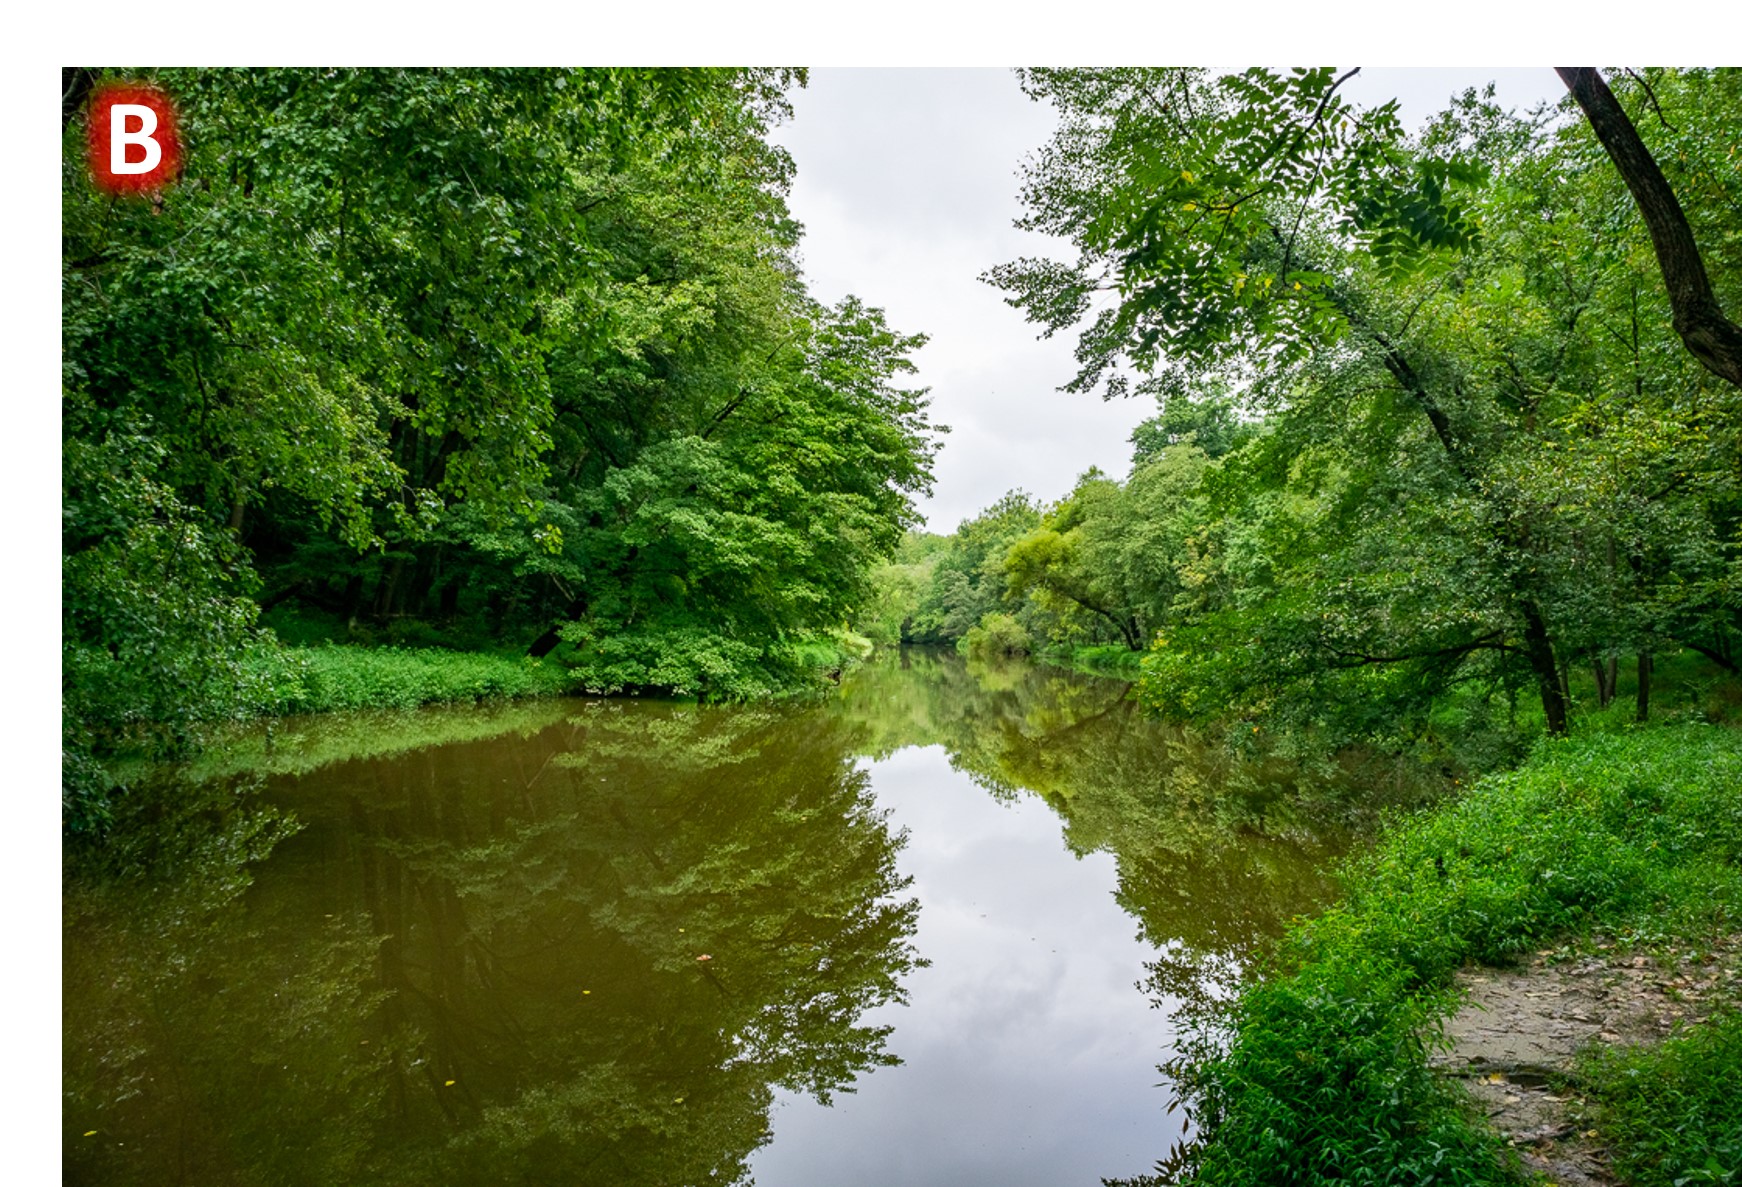
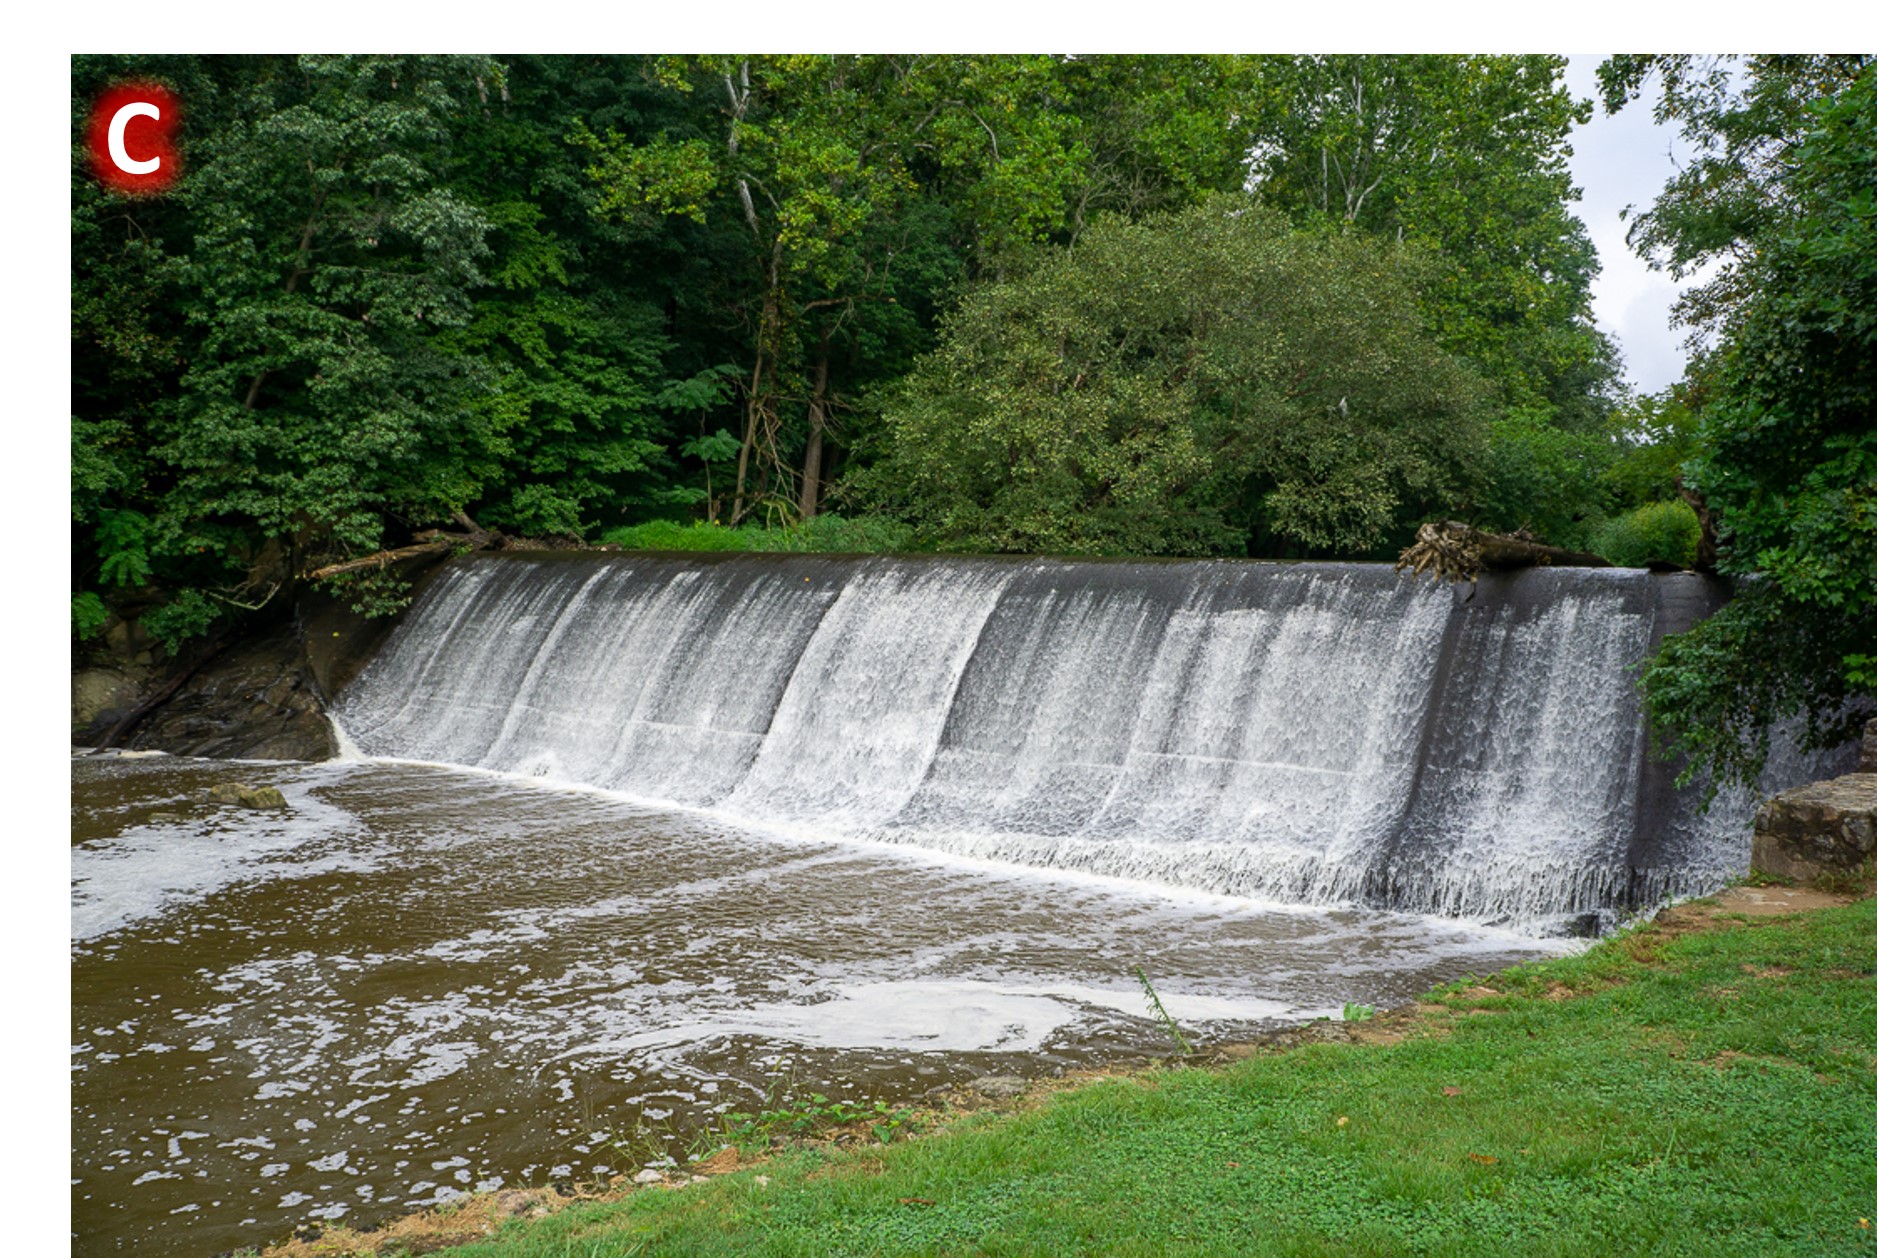
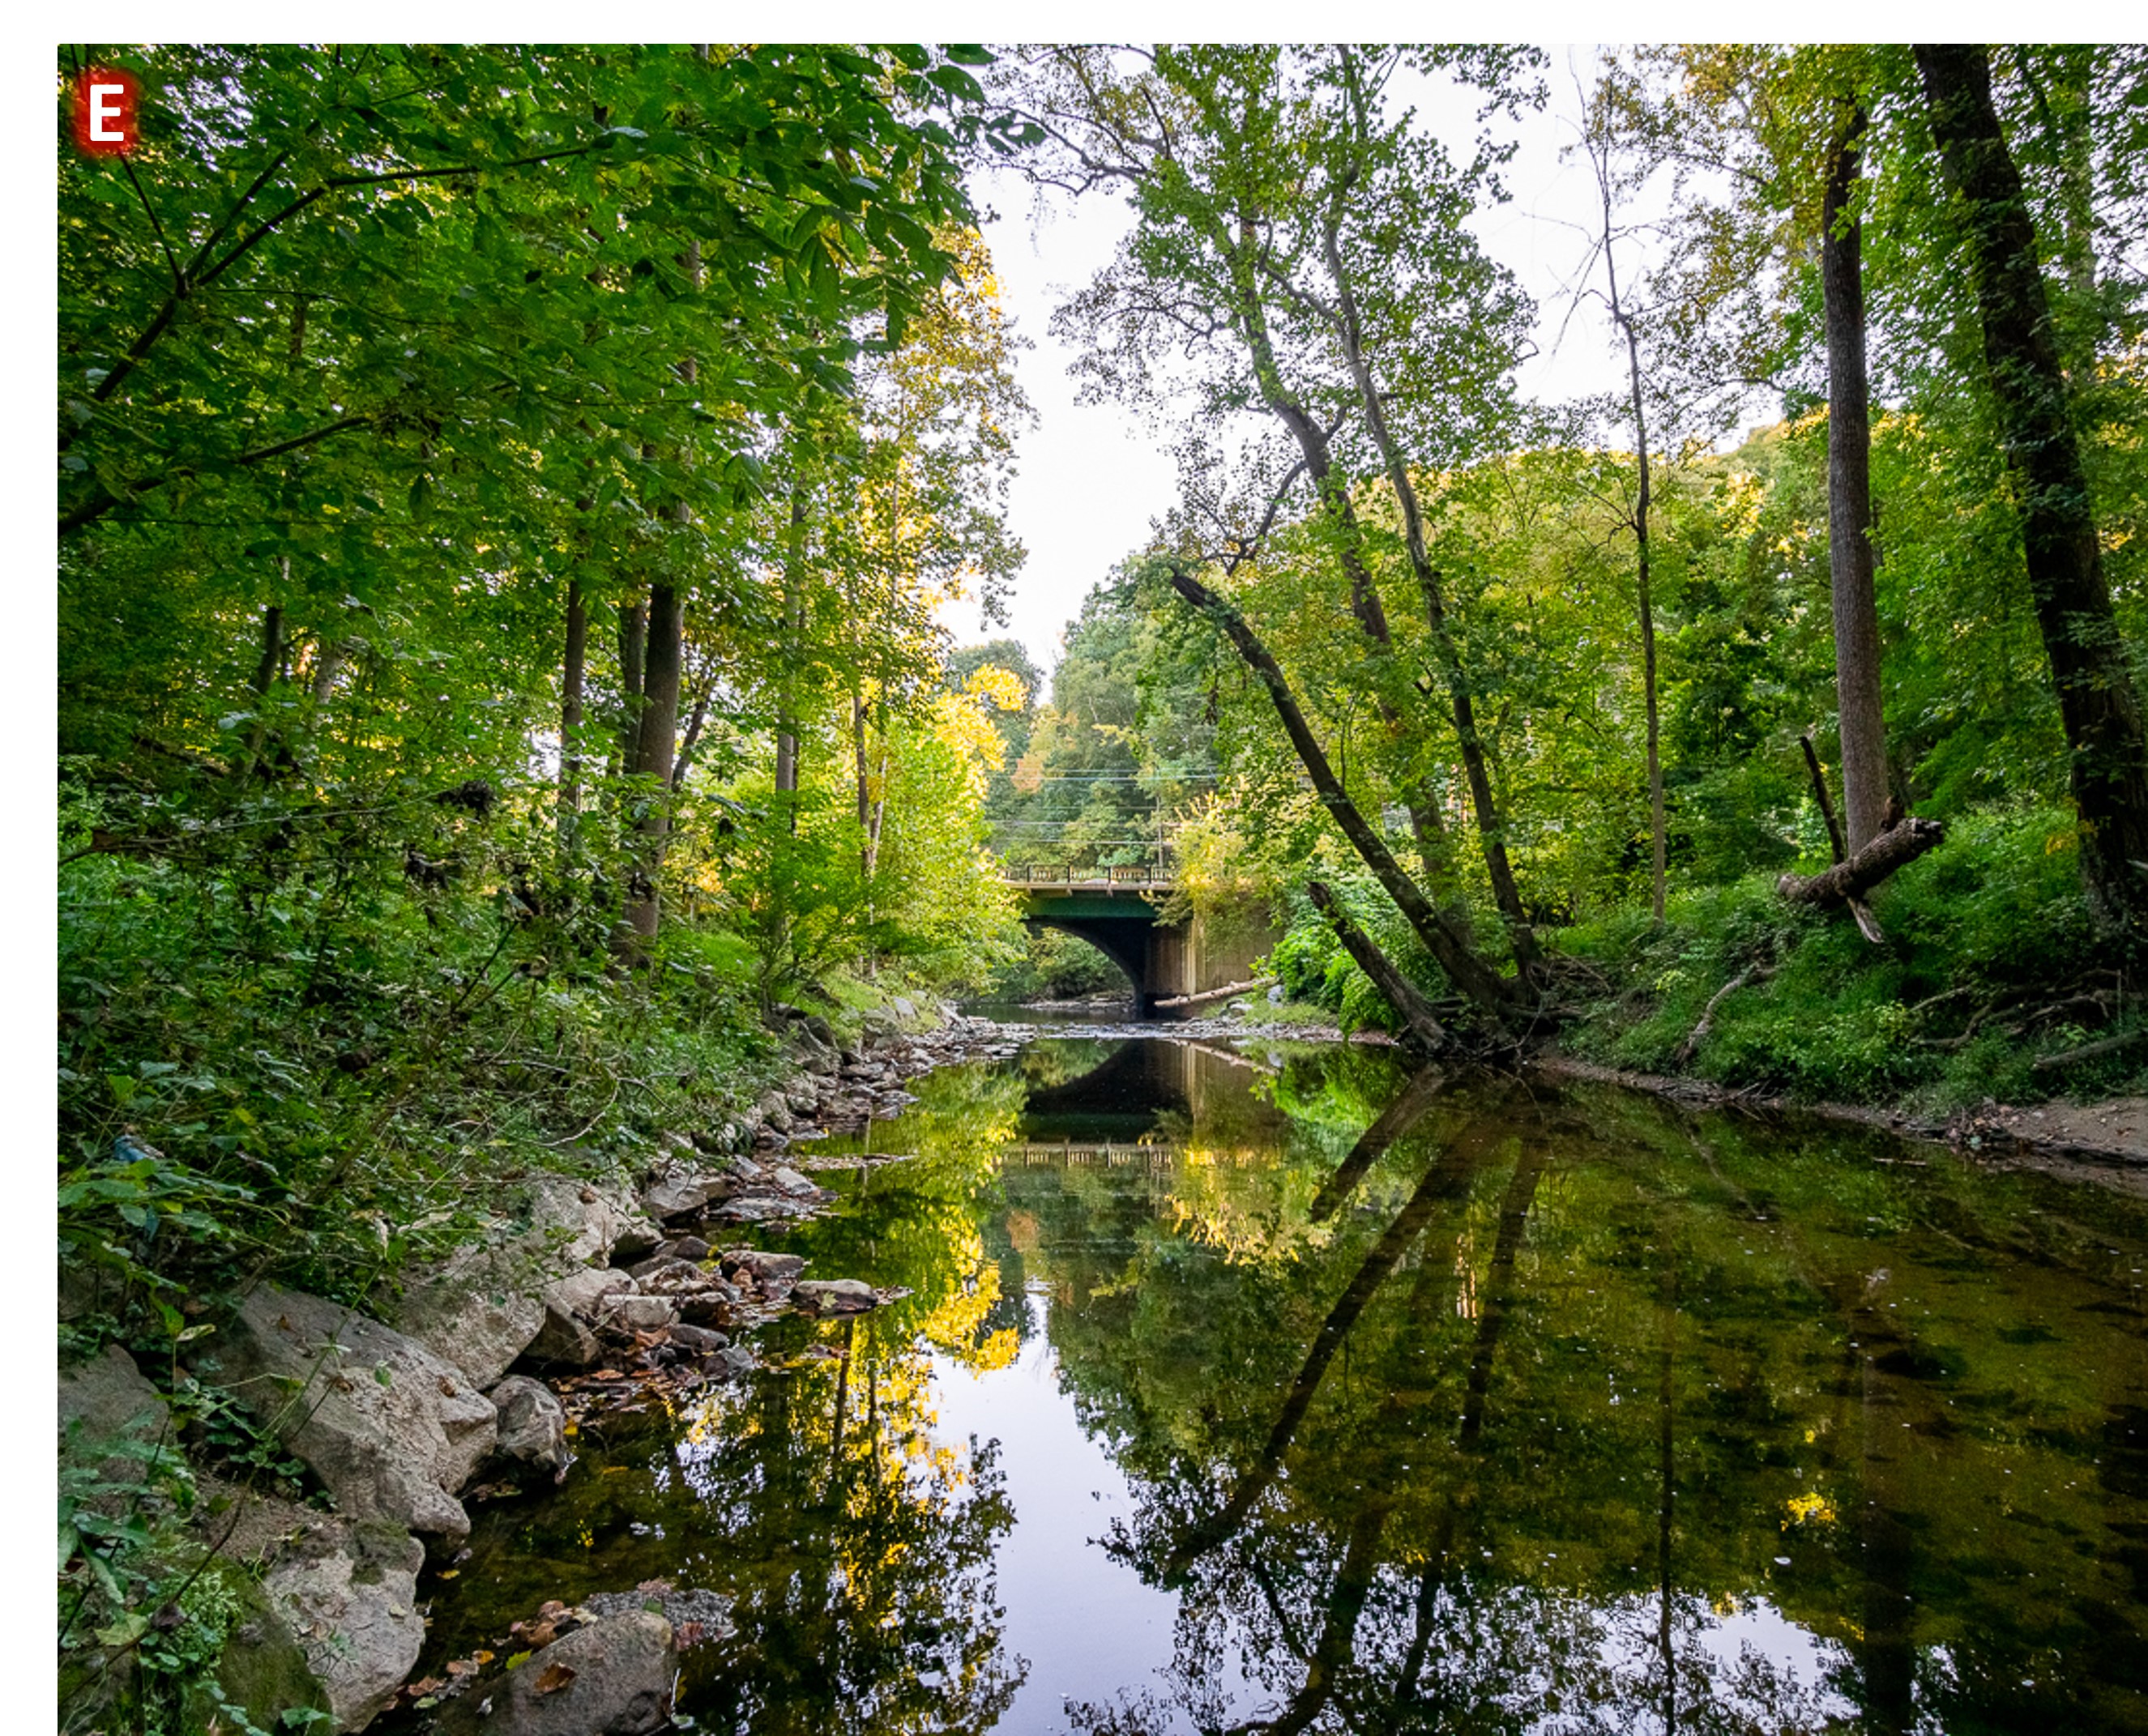
Photographs of the main stem. (A) shows the upstream portion of the main stem incised into the Piedmont Alluvium. The river here is meandering with a shallow gradient; a gravel point bar is shown. (B) shows the main stem directly above the Burnt Mills enhanced knickpoint. Stream flow here is impounded behind the concrete dam structure. (C) shows the Burnt Mills enhanced knickpoint. The concrete structure was built up approximately one meter above the existing bedrock knickpoint. (D) shows the Burnt Mills bedrock knick zone downstream of the enhanced knickpoint and Colesville Rd. (E) shows the main stem incised into the Piedmont Bedrock near the Coastal Plain transition.
The study reach consists of tributaries and their catchments that enter the channel above and below the active knickpoint. An examination of the spacing between tributary valleys indicates that tributary spacing decreases by over 50% below the knickpoint, suggesting active tributary formation due to channel incision, and perhaps more active hillslope erosion processes in a periglacial climate (Merritts & Rahnis, 2022).
Elevation profile parallel to the main stem along the eastern terrace showing the spacing between tributary valleys perpendicular to the main stem. The average distance between valleys above the knickpoint is more than twice the spacing between the valleys below the knickpoint. The valleys above the knickpoint also have greater average relief, showing that there are fewer but larger valleys above the knickpoint. As landscapes mature and approach dynamic equilibrium, convergence and stream piracy result in fewer but larger drainages. Convergent processes dominate over diffusive processes, resulting in increased concavity (Perron et al, 2008).
These small tributaries have also been affected by two major land use changes: Erosion and siltation associated with European settlement and agricultural practices, and urban runoff associated with post-WWII period urban development (Leopold, 1968). Construction activities have brought periods of high sediment loads into individual catchments and affected main stem sediment transport (Allmendinger et al., 2007).
Suburban-Era excavated sand deposited on top of legacy Agricultural-Era silt in the Coastal Plain portion of the Northwest Branch.
Suburban development is concentrated on the flatter ridge tops of these tributary catchments, which often convey runoff via stormwater channels to outfalls near the drainage divides. Our preliminary geophysical research indicates that this suburban development covers the thickest soil depths above the bedrock.
Heavily sediment-laden runoff from a construction site drained by a Northwest Branch tributary mixing into the mainstem following a summer storm.
The study reach includes tributaries with and without stormwater system contributions. Two tributaries in the Gunpowder River Basin in Baltimore County, MD are being studied as reference streams. These tributaries, Baisman Run and Pond Branch, are heavily forested and located above the Fall Zone. There is minimal suburban development in their catchments, none in the case of Pond Branch, and no stormwater system inputs. They are not influenced by knickpoint adjustment due to their position above the Fall Zone.
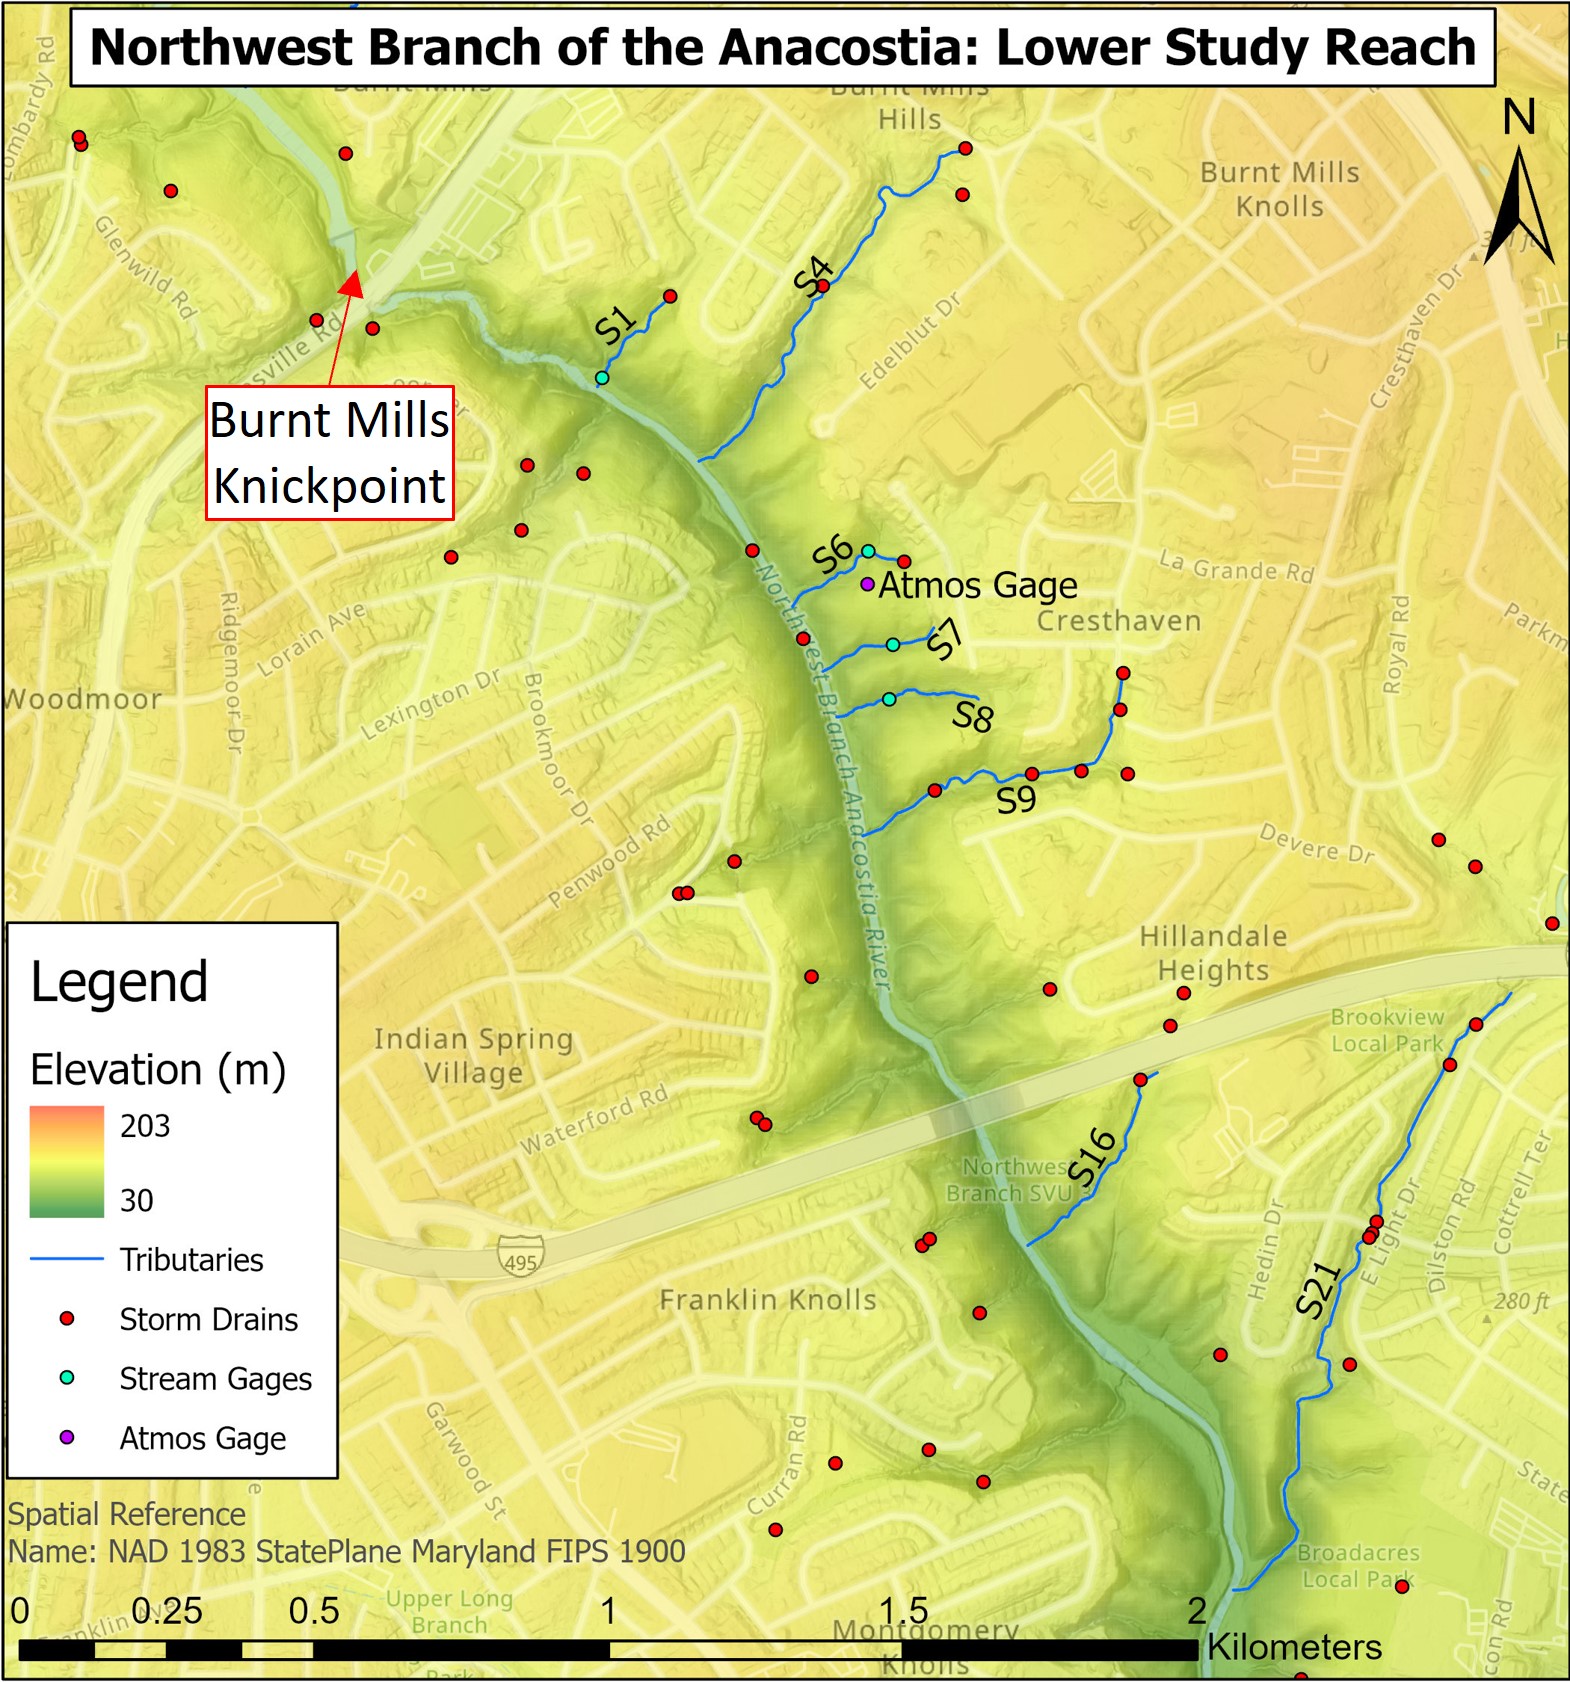
Map of the Northwest Branch study reach with the locations of the tributaries being studied, their stream gage locations, and storm drain outfalls. Tributaries S7 and S8 are the only tributaries not initiated by storm drain outfalls. The location of the atmospheric pressure gage used to correct the barometric pressure on the stream gages is also shown. The increased steepness of the hillslopes downstream of the knickpoint is evident with this elevation map. The forested reference tributaries in Baltimore County above the Fall Line are displayed in the inset map.
Map of the Northwest Branch tributary catchments being studied. The reference tributary catchments are shown in the inset map. The catchments were delineated using a LiDAR-derived digital elevation model analyzed with ArcGIS Hydrology tools. The catchments consist of primarily upland suburban development drained by stormwater systems, with forest cover on the hillslopes and valleys buffering the Northwest Branch. Catchments N1-N17 are above the Burnt Mills knickpoint, while Catchments S1-S21 are downstream of the knickpoint. “Type A” designates catchments of tributaries that appear to have been formed in response to knickpoint initiation. “Type B” designates those that appear to have existed prior to initiation of the knickpoint. The portions of the catchments incised into bedrock are indicated with lighter shades.
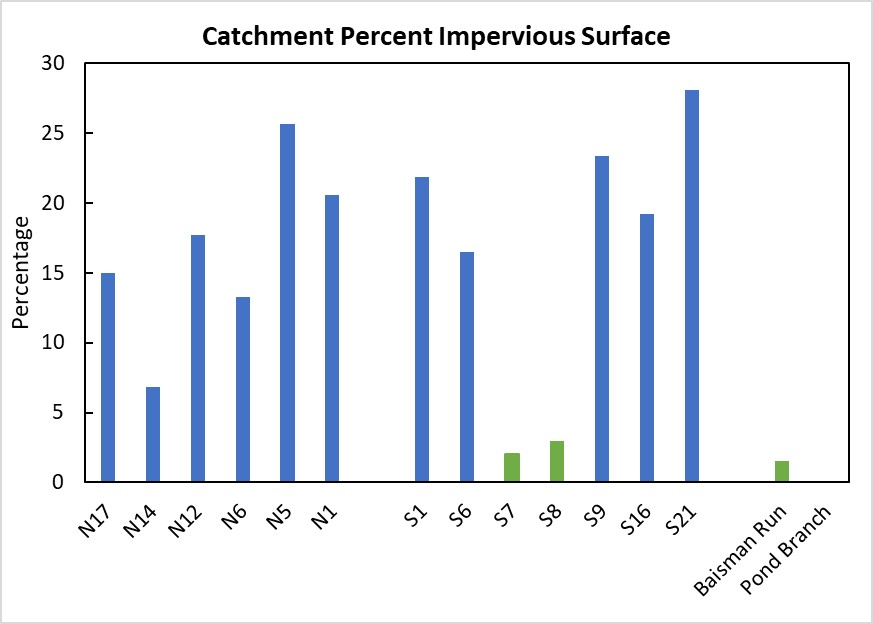
The percentage of impervious surface in each tributary catchment and the reference catchments. Catchments above and below the knickpoint show similar impervious cover except for S7 and S8, which do not have suburban development and stormwater systems. These plot with the undeveloped reference catchments.
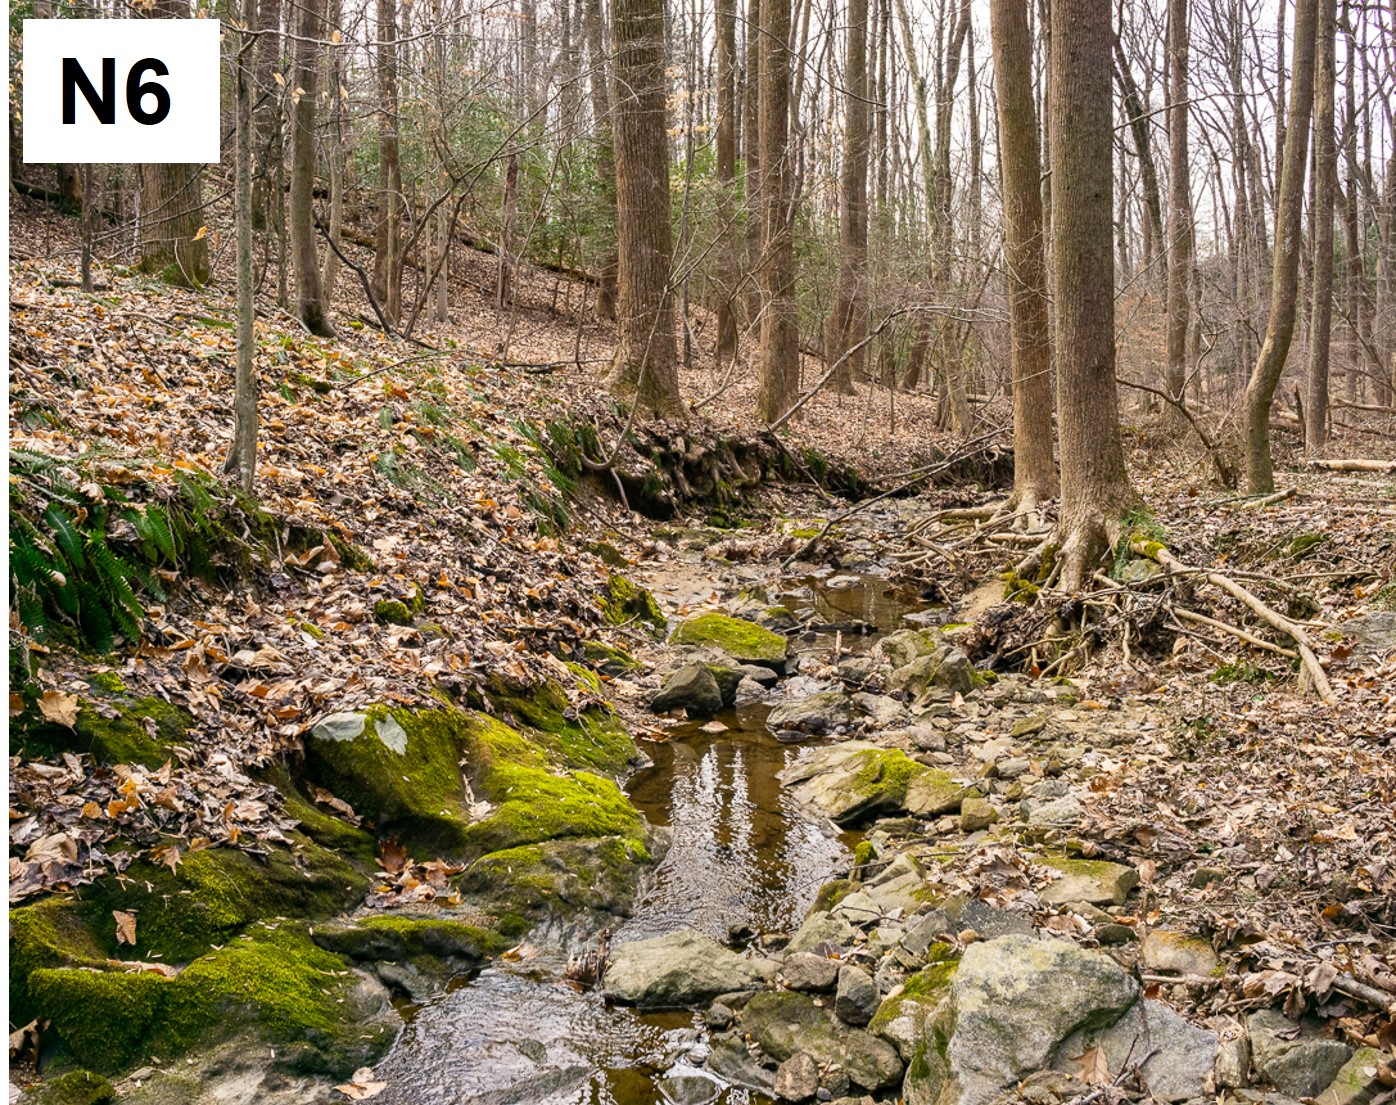
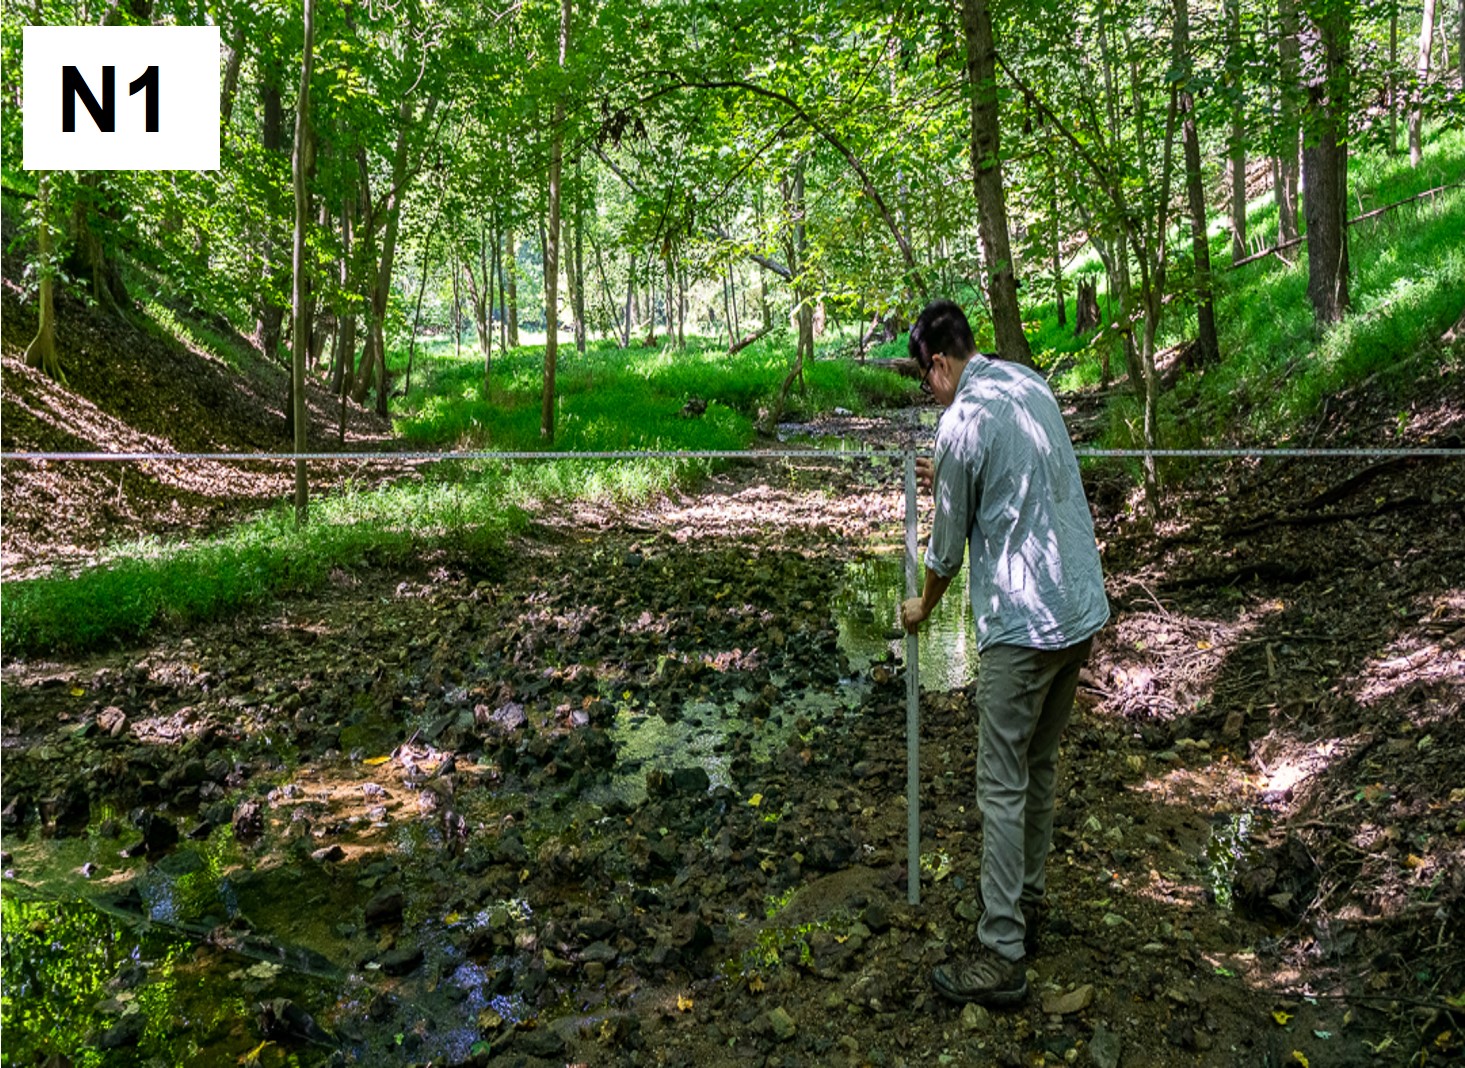
Representative photos of Northwest Branch tributaries being studied: N6: Channel incised into the bedrock just downstream of the main storm drain outfall initiating the channel. N5: Cut bank with approximately 10 meters of incision into the Agricultural-Era legacy silt. N1: Channel with floodplain near the mouth, floodplains are not present in most downstream tributaries.
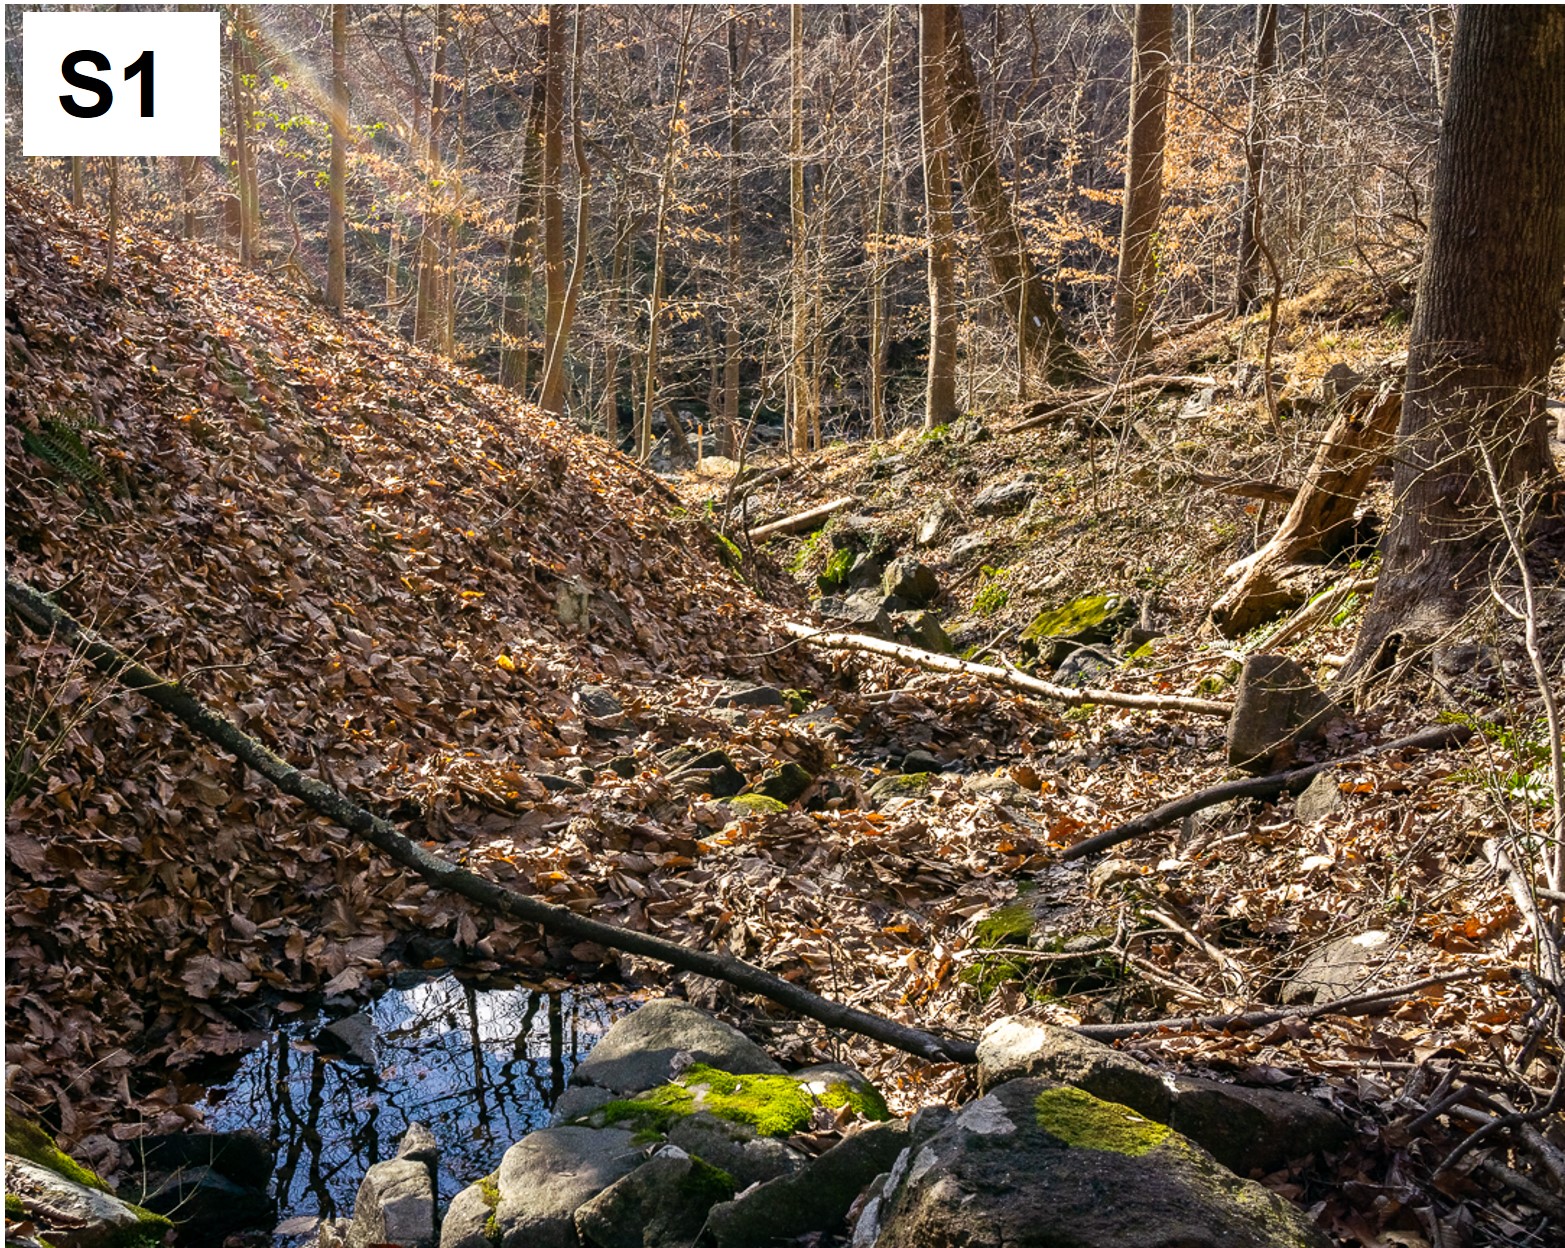
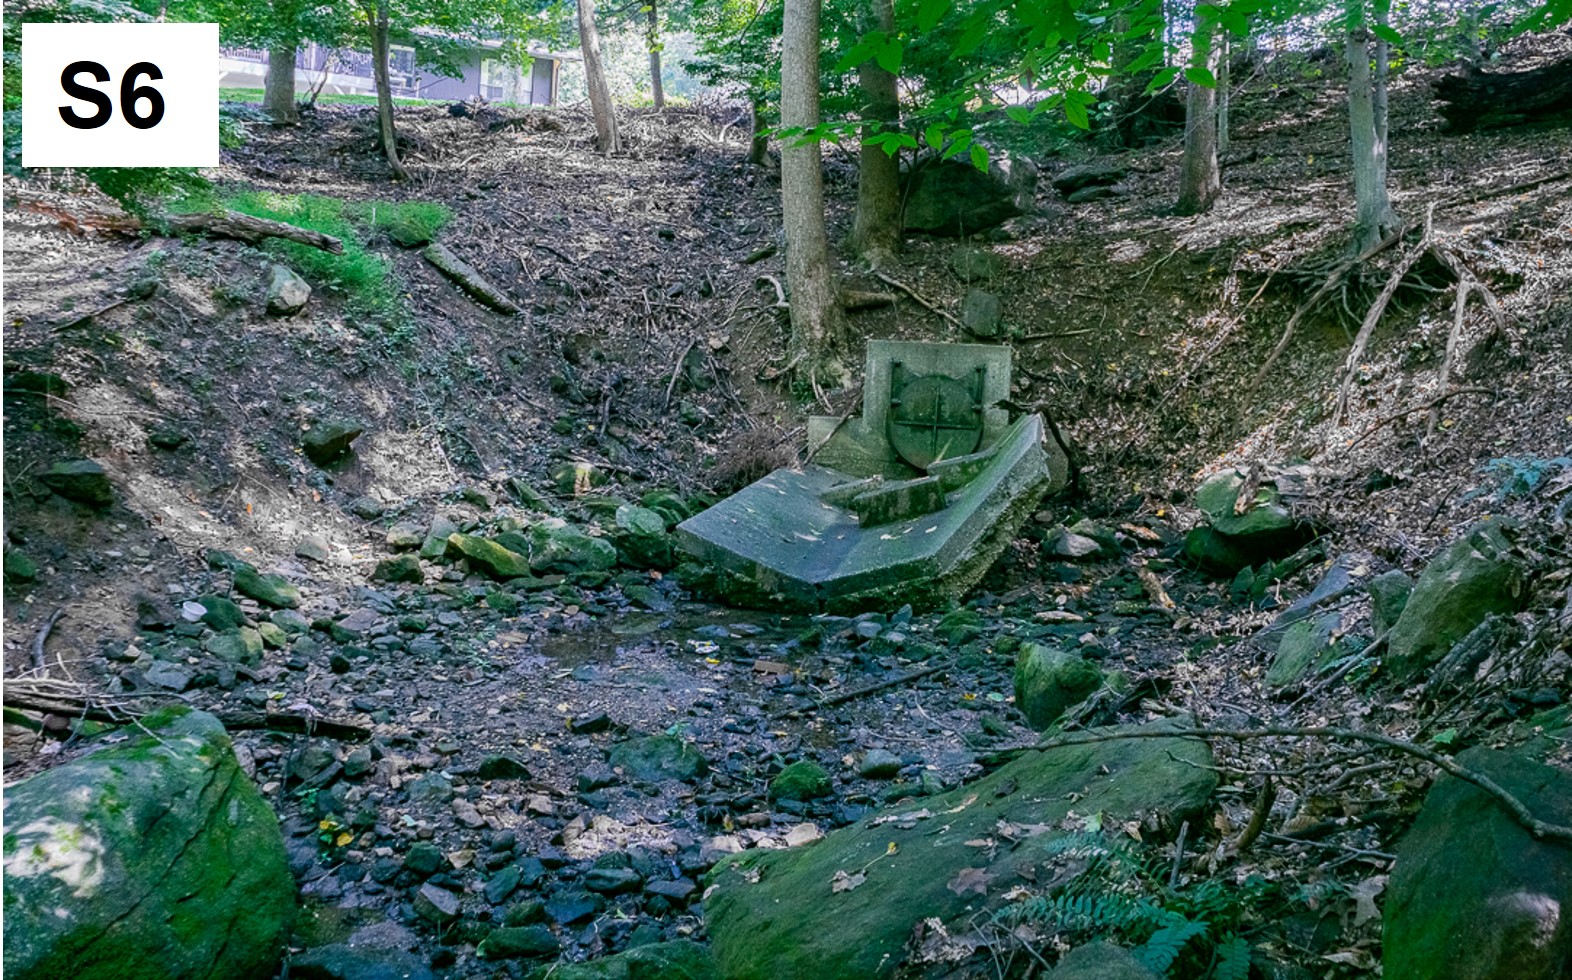
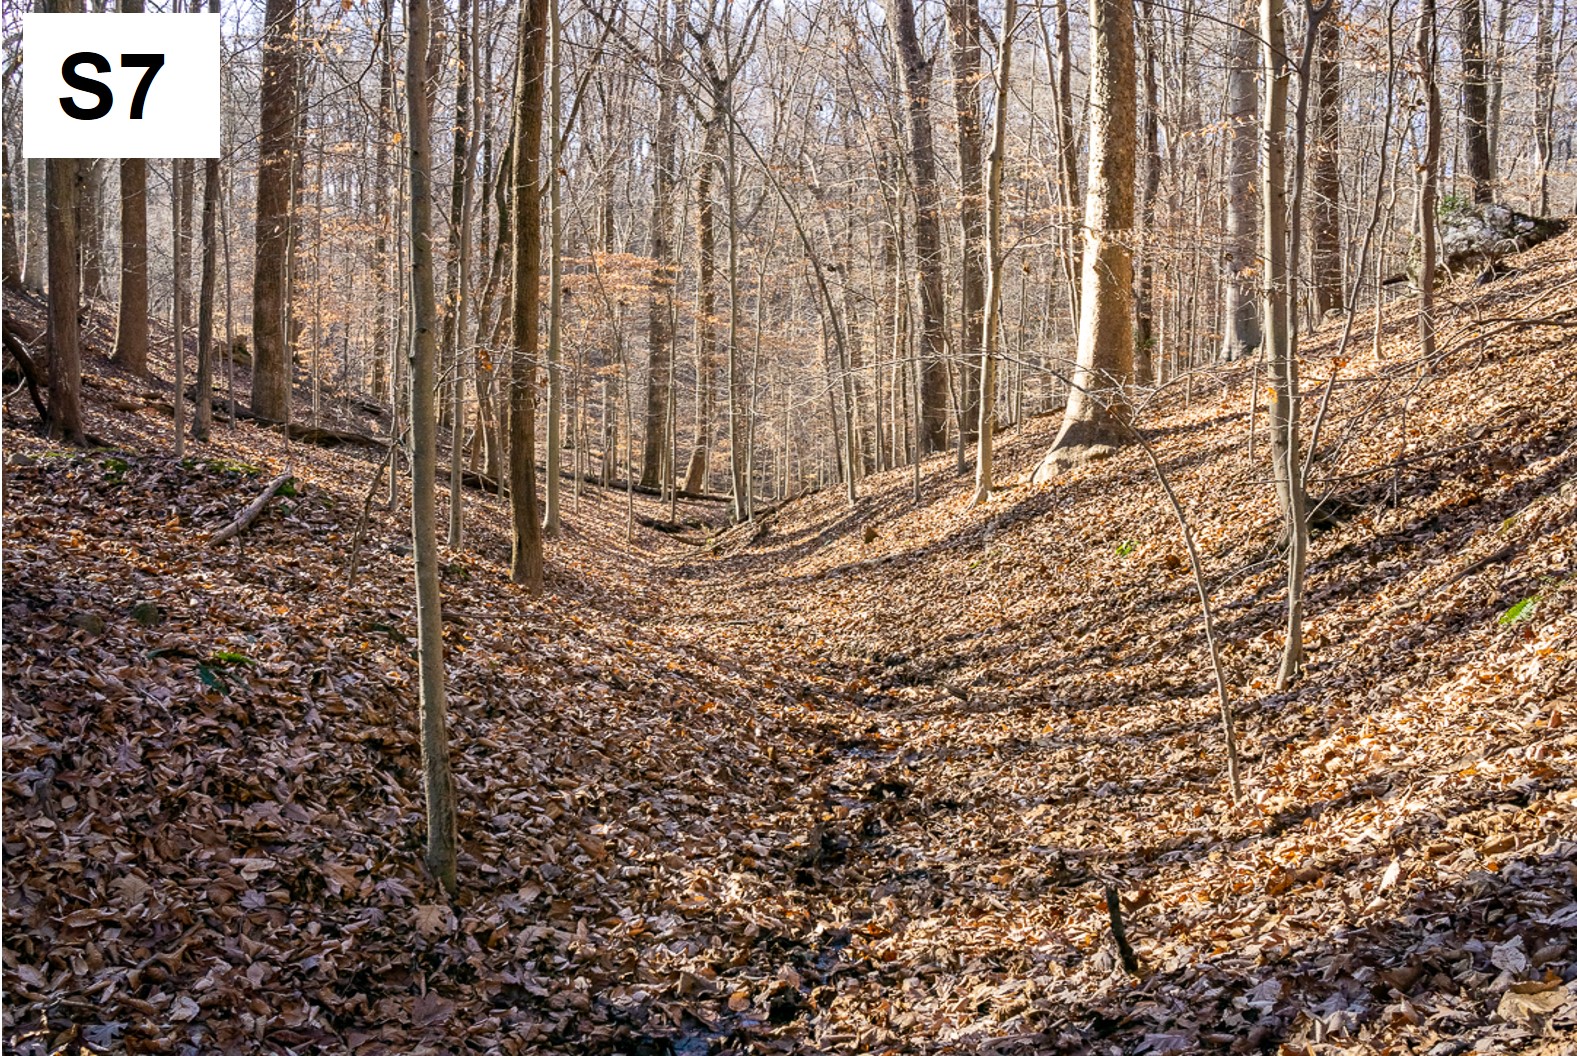
S1: Steep channel with step-pool morphology. S6: Storm drain outfall at the channel head, note the significant headward erosion. S7: Tributary without stormwater system contributions. Note the gentle V-shaped valley and leaves covering the channel. Baseflow and most stormflows are not able to mobilize the leaves in the channel, and instead flow under them.
By 2030, urban land cover in North America is projected to nearly double its extent from the year 2000 (Seto et al., 2012). Much of this development will be concentrated along urban corridors, like the Eastern Seaboard (Nowak & Walton, 2005). Increased impervious surface due to urban development results in hydrologic impacts such as: Increased flashiness, greater magnitude and frequency of storm flows, and changes to baseflow due to reduced infiltration surface (Walsh et al., 2005). With impervious cover replacing soil and vegetation, infiltration and recharge of watershed storage is reduced (Gregory et al., 2006). This increased runoff due to impervious surface necessitates the construction of stormwater systems to efficiently convey discharge to streams and reduce flooding of developed areas. Higher runoff efficiency to streams exacerbates the hydrologic impacts of urbanization (Leopold, 1968).
Illustration of urban hydrological impacts vs natural lands.
My research is funded as part of the National Science Foundation Urban Critical Zone Cluster, which studies the interaction between the geologic template and the urban footprint and the effects on critical zone processes along the Eastern Seaboard.
The “Critical Zone” refers to Earth’s outer skin, from the bedrock to the treetops. It is an environment where rock, soil, water, air, and life interact and shape the surface of our planet (Brantley et al., 2007).
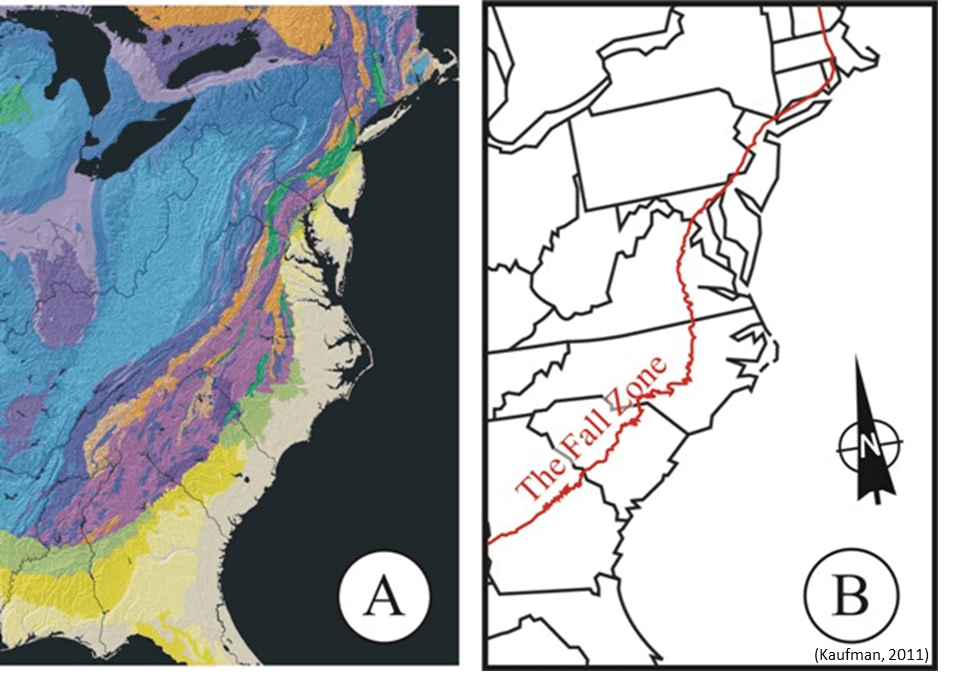
Although hydrologic impacts scale with increasing impervious cover, physical factors (topography, stream morphology, lithology) influence the nature and magnitude of these impacts (Hopkins et al., 2015). Hydrologic responses to urbanization vary between and within physiographic regions. These variations due to physical factors are not well understood at smaller scales (Hopkins et al., 2015). East Coast rivers crossing the Atlantic Fall Zone straddle multiple physiographic regions and exhibit spatial variations within those regions. The Fall Zone marks knickpoints that propagate upstream from the Piedmont crystalline bedrock/Coastal Plain sediment boundary. Sharp increases in stream gradient, or knickpoints, occur where rivers cross this lithologic contact or where those knickpoints have propagated upstream (Bierman, 2015).
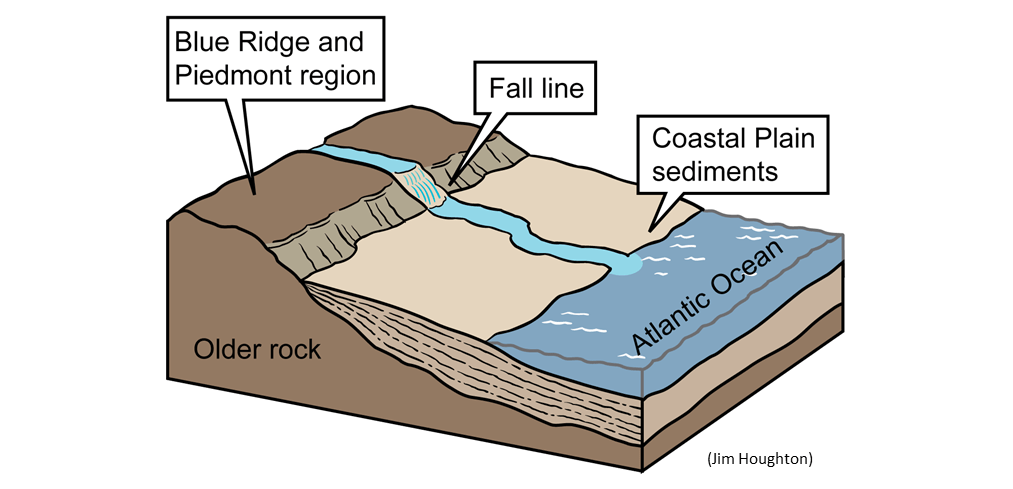
The Fall Zone marks the transition from Piedmont crystalline bedrock to Coastal Plain sediment. Impassable rapids formed on rivers crossing this contact. Many East Coast cities, including Washington DC, Baltimore, Philadelphia, Trenton, Richmond, and Raleigh sprung up along the Fall Zone to make use of hydropower and because ships could not travel any further upstream.
Knickpoint along the Fall Line. This sharp increase in stream gradient forms where erodible Coastal Plain sediment meets resistant Piedmont crystalline bedrock that the river has more difficulty incising through.
Knickpoints propagate upstream due to headward erosion, the rate of propagation is proportional to rock erodibility and stream power. Base level drops rapidly below the knickpoint (Penck, 1924). Tributaries to the mainstem incise downward to meet this lower base level, and this erosive signal is transmitted up the channel to the hillslopes of the sub-watersheds and on to the drainage divides. The landscape above the knickpoint does not receive this erosive signal and so differential incision along the mainstem results, with steeper channels and hillslopes below the knickpoint (Wegmann et al., 2011). These steepened tributary channels tend to take on a more convex profile as they rapidly incise downward to meet the drop in base level, departing from the concave upward profiles typical of a landscape in dynamic equilibrium (Seidl et al., 1994). New channels may be initiated to drain the steepened catchments, with an overall increase in drainage density (Perron et al., 2008).
Physical stream characteristics change downstream of knickpoints, and corresponding hydrological changes may occur within contributing watersheds. Groundwater fluxes from watershed storage increase with hillslope steepness, but this effect may be countered by soil permeability (Sayama et al., 2011; Tetzlaff et al., 2009). In regions where bedrock is shallow and relatively impermeable, like the Mid-Atlantic Piedmont, steeper watersheds with shallow bedrock may have reduced effective storage (Troch et al., 2003). A study of urban watersheds across the United States in various physiographic regions showed that flatter, more permeable terrain reduced the severity of hydrologic impacts due to urbanization (Hopkins et al., 2015). Portions of watersheds that are steeper and more eroded due to knickpoint adjustment may exhibit lower storage (baseflow) and perhaps higher storm runoff.
Due to scale-dependent factors, such as travel times, relief, etc. small watersheds (≤1-2 km2) may experience increased severity of hydrologic response due to urban impacts (Berthier et al., 2004; Meierdiercks et al., 2010; Yao et al., 2016). Small watersheds respond more rapidly to storm events, with shorter transfer times of runoff to the channel and faster lag times of discharge pulses moving downstream (Berthier et al., 2004). These shorter transfer times may limit runoff infiltration into the soil or streambed, reducing recharge of subsurface storage and increasing overland flow (Singh, 1997). These scale-dependent factors may enhance the speed and magnitude of hydrologic response of small watersheds to knickpoint adjustment, but the controls have not been well-studied. The catchments above and below the Fall Zone knickpoint studied in this project are small watersheds under 2 km2.
The goal of this project is to understand the effects of increased urban runoff on small tributaries to the Northwest Branch of the Anacostia River, an urbanized Fall Zone stream, and the physical factors that influence hydrologic response. We are examining how differential incision due to knickpoint propagation has influenced tributary morphology and soil thickness in the catchments available for subsurface storage, and how those physical factors affect baseflow and stormflow responses in the tributaries. Geomorphologic factors have not been incorporated effectively into current ideas on watershed storage and urban runoff response. We hope to better understand those controls with this project.
Hunting Island is a barrier island along the southern coast of South Carolina. Due to coastal development, it is rare to see a barrier island in such a natural state! The island is a real treasure, but its days are numbered. Hunting Island is eroding away into the sea. Barrier islands are highly dynamic systems, constantly forming and disappearing as currents, waves, and storms erode away and re-deposit sand.
Barrier islands are elongate strips of sand that form parallel to the coastline, often occurring in chains separated by narrow inlets. Lowlands separating the raised sand dunes of the barrier islands from the mainland flood and turn into narrow, protected, low-energy bays, where tidal flats, salt marshes, and lagoons form. Barrier islands play a critical role in protecting the coastline from storms. However, that defense is lost when the heaviest development occurs on the barrier island itself, as so often is the case along the Atlantic and Gulf coasts where barrier islands occur.
Map provided by Hunting Island State Park.
The park map of Hunting Island above shows, moving from the coast towards the mainland: beach – dune sequence – salt marsh and tidal creeks. On the southern end of the island, you can see where a new barrier island sequence is forming on the seaward side of the barrier island itself! The sea has filled into the topographic low between dune ridges, creating a lagoon. The spit of land between the lagoon and the sea was breached by recent hurricanes, forming an inlet cutting off the bottom corner of the island, creating a new barrier island called Little Hunting Island. Eventually the spit will be breached again, forming more islands.
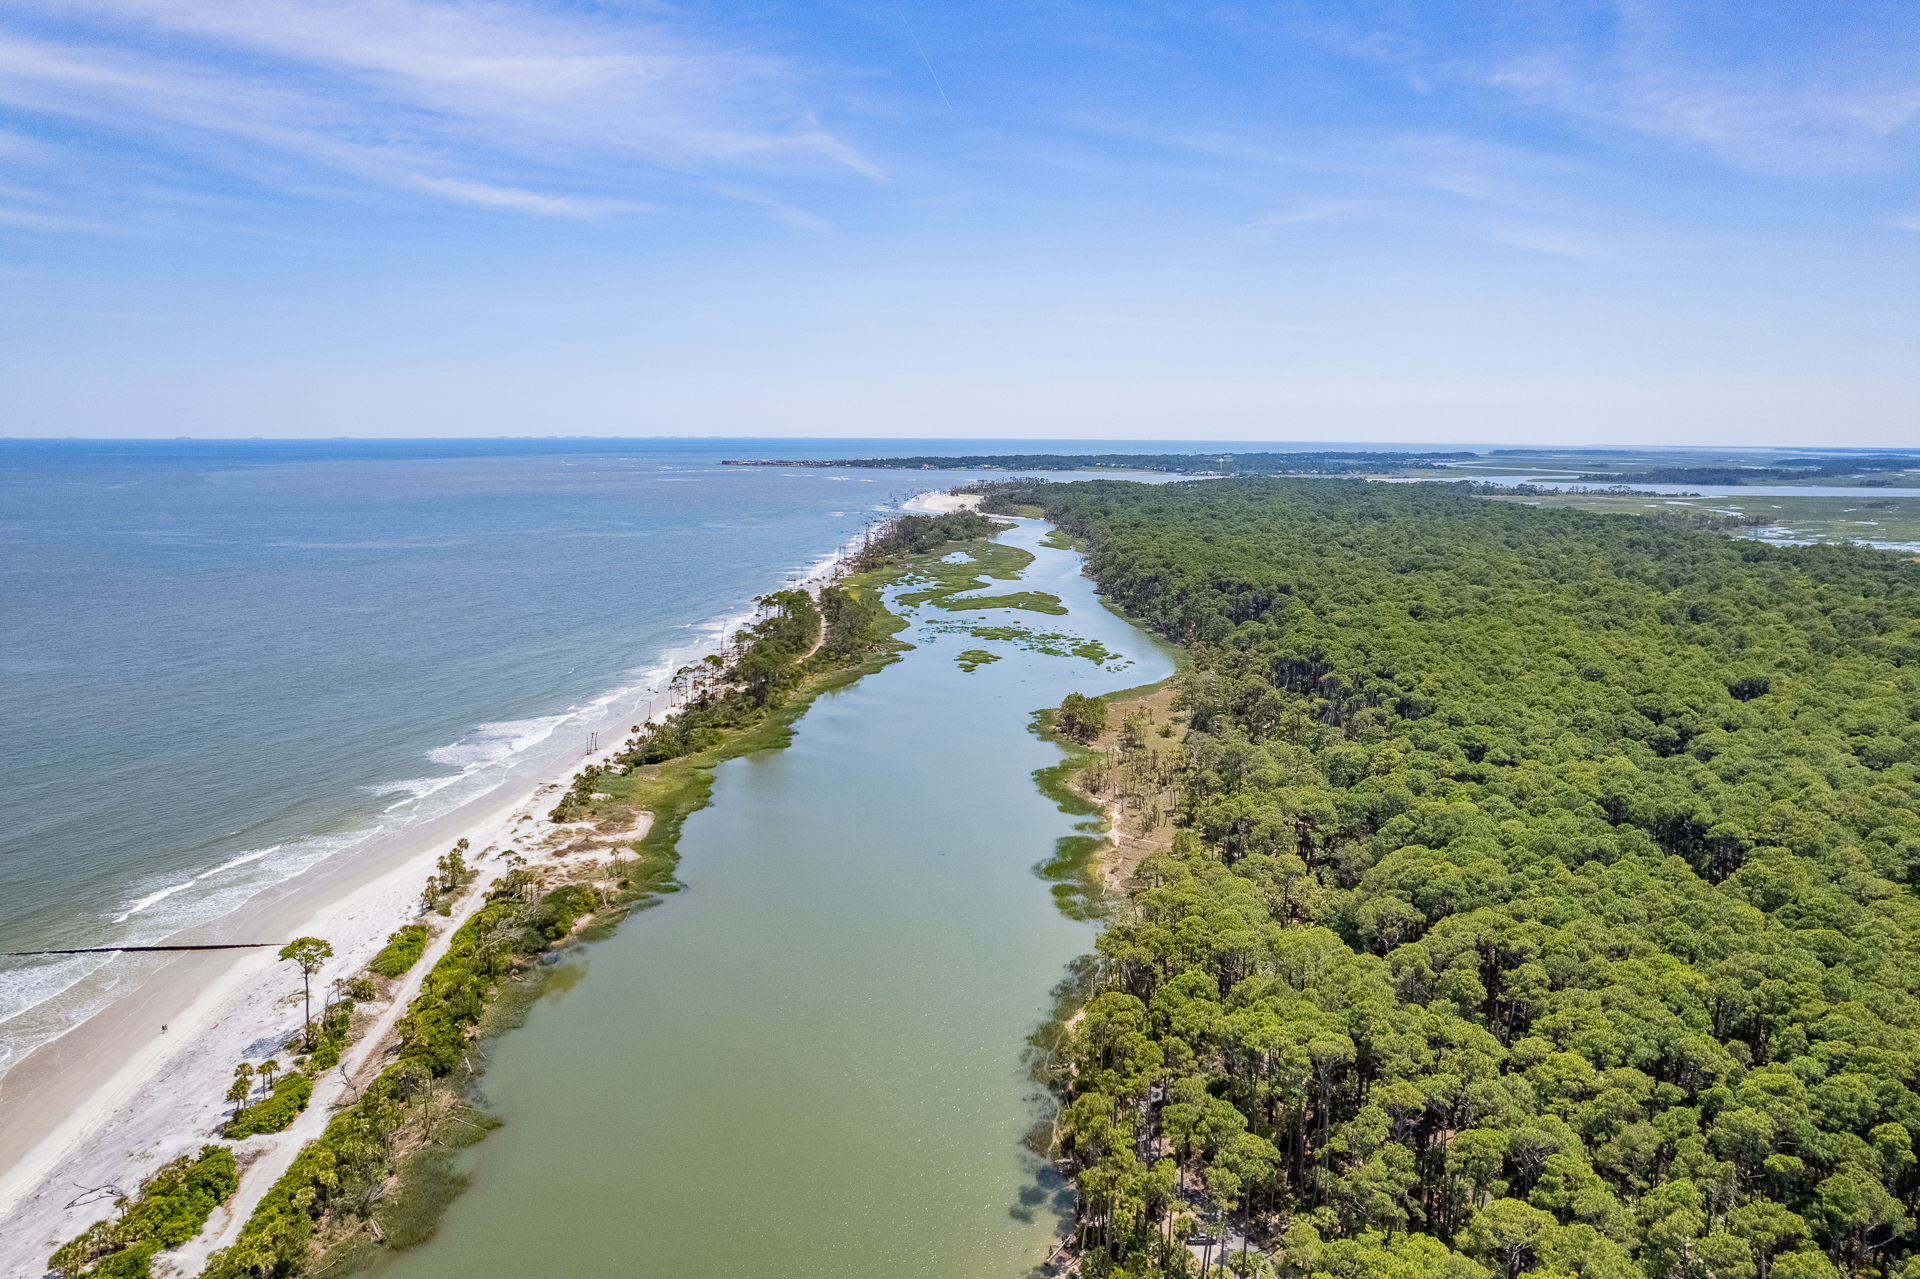
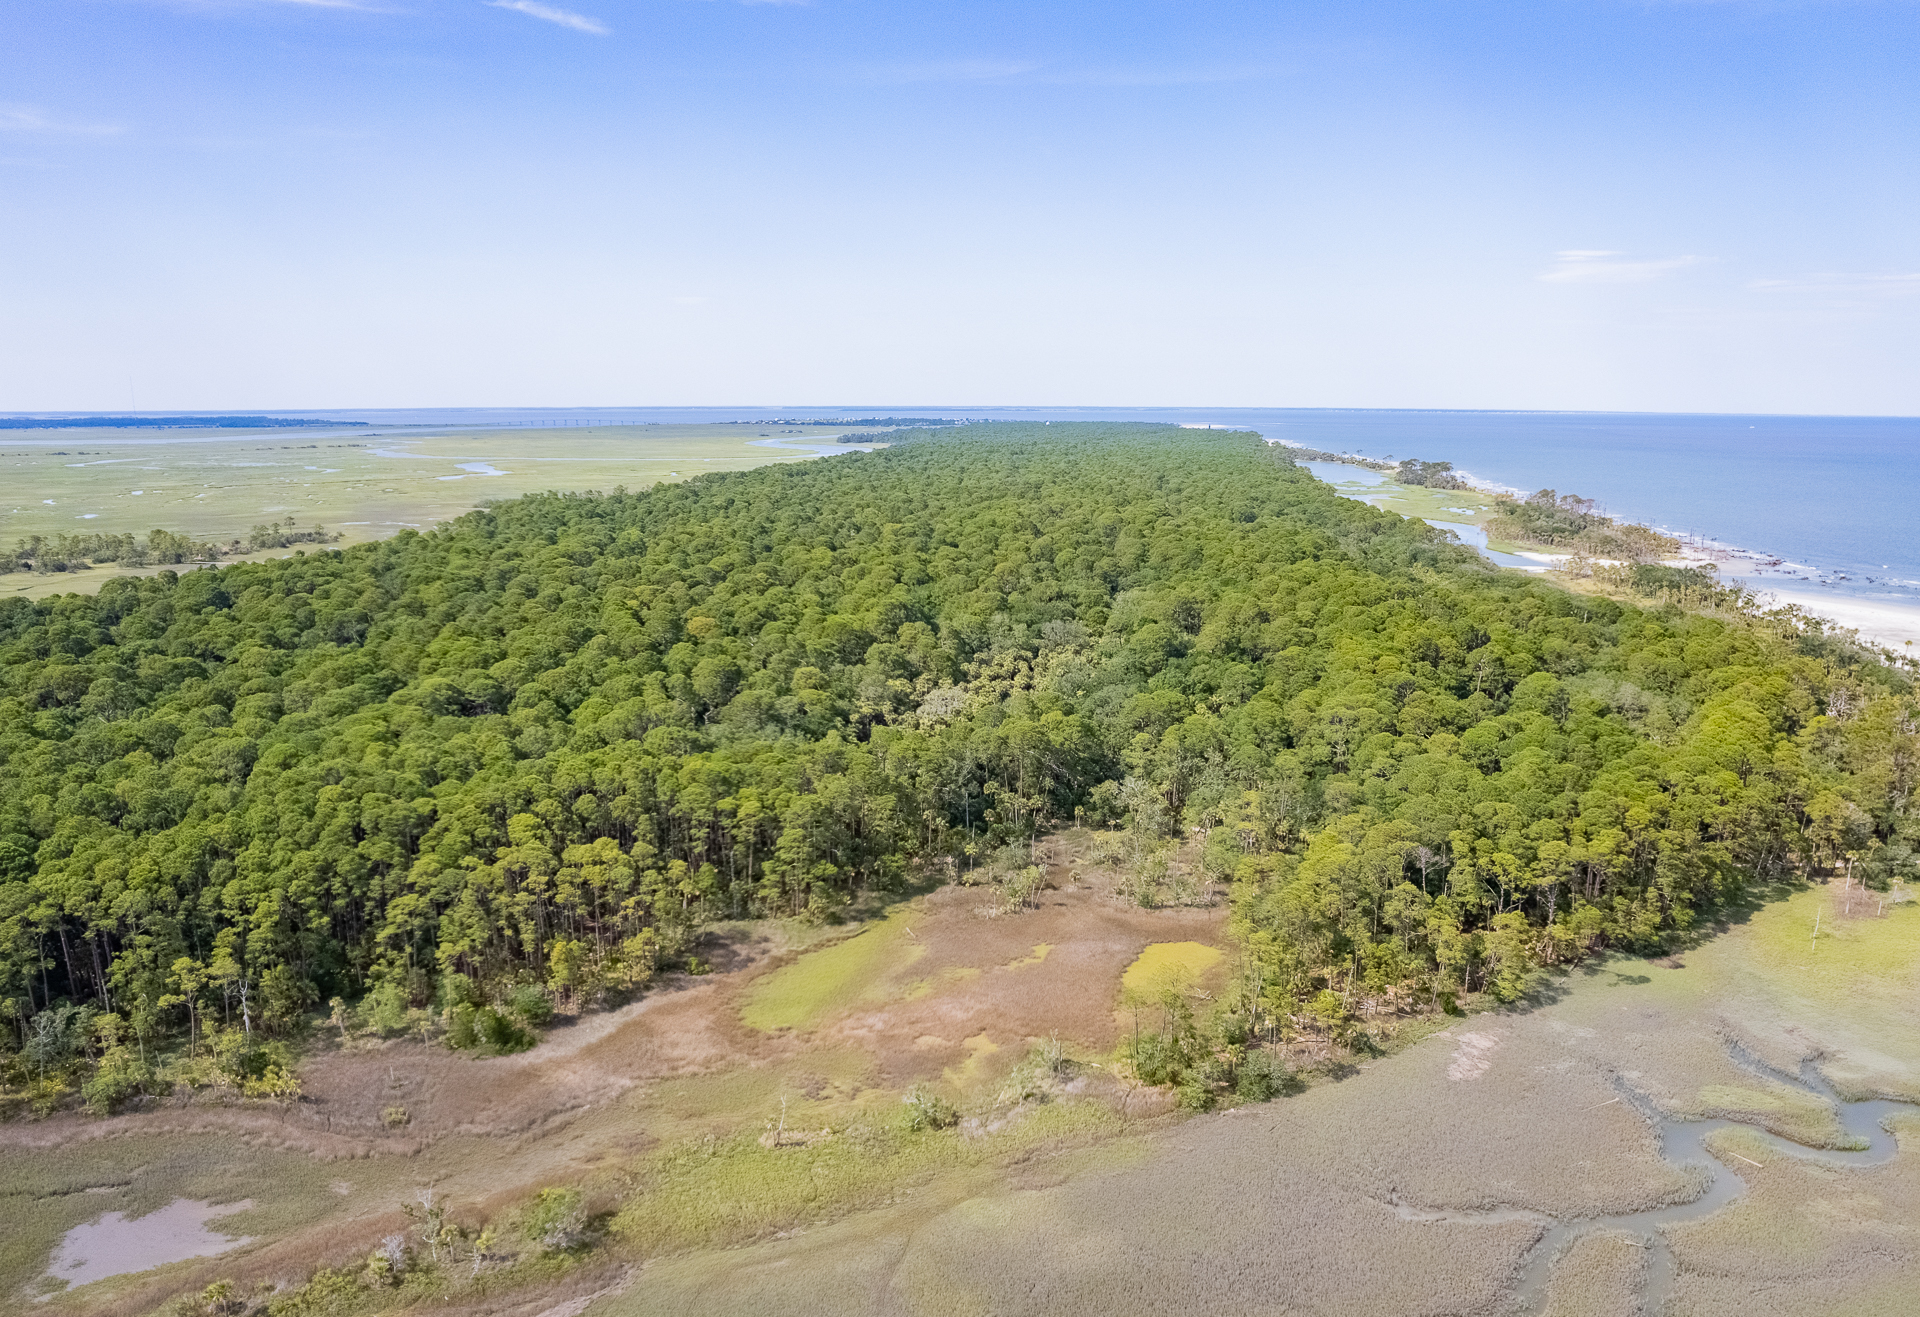
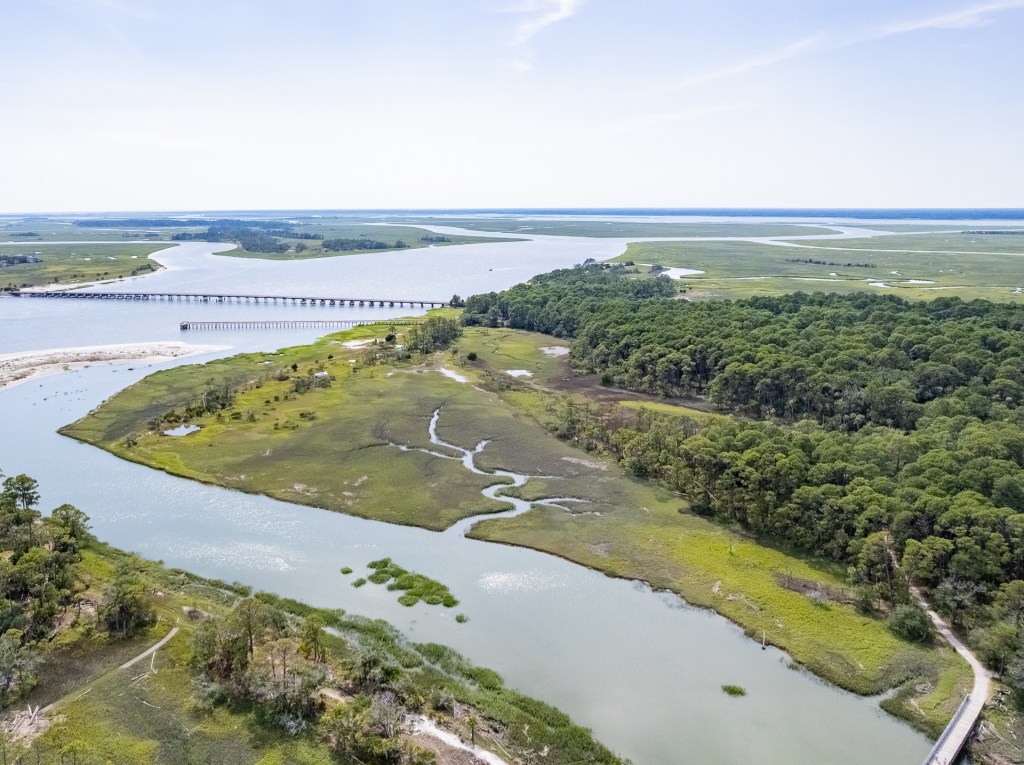
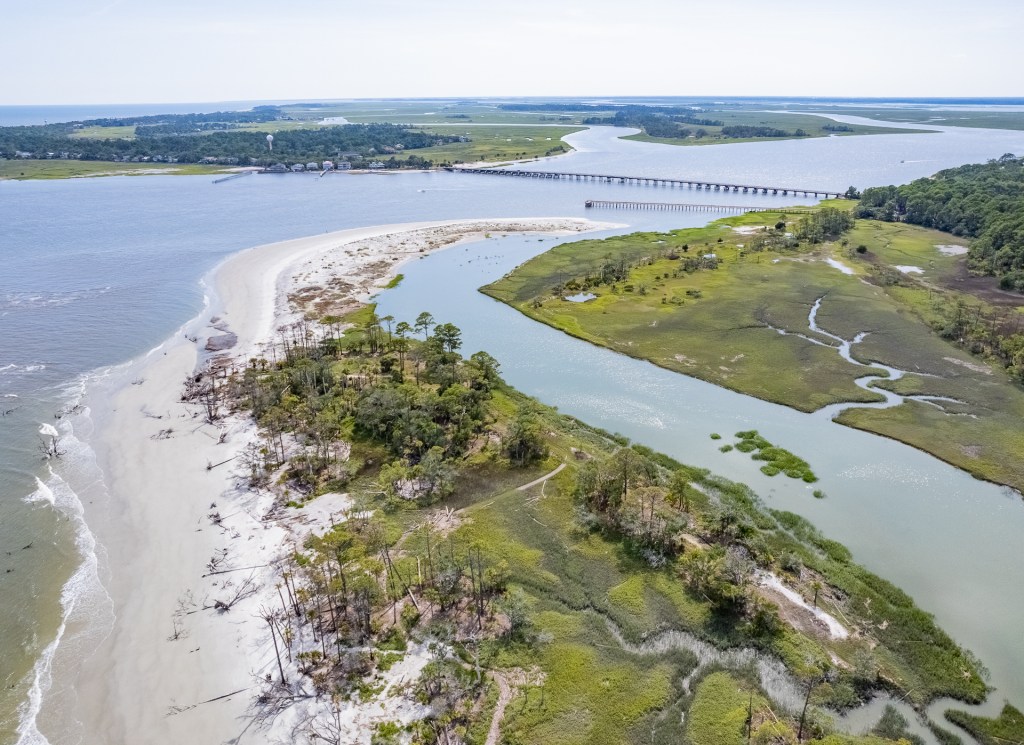
Aerial view of Hunting Island starting in the north and moving to the west. Note the sequence of beach, dunes with maritime forest, then landward salt marsh with tidal creeks.
Salt marsh with tidal creeks on the southern and landward sides of the island.
Lagoon on the seaward side of the island. The same barrier island sequence of beach – dune ridge – salt marsh is present here on a smaller scale. As the lagoon breaches, smaller barrier islands off of the main barrier island are formed.
While Hunting Island has largely been free to follow its natural processes, some evidence of human interference to slow longshore drift can be observed. Waves do not strike the coastline head-on, but rather at an oblique angle. This results in a net movement of sediment in a prevailing direction parallel to the coastline.
Diagram demonstrating longshore drift: 1=beach 2=sea 3=longshore current direction 4=incoming waves 5=swash 6=backwash.USGS/USGov, modified by Eurico Zimbres.
At Hunting Island the prevailing longshore drift direction is to the north, so the island is eroding away to the south and depositing to the north. So does that mean the island is growing to the north? Normally it would, but strong seaward currents from St. Helena Sound along the northern end of the island flush the sediment migrating north from longshore drift directly out to sea, depositing it miles away into the Atlantic Ocean. Currents moving towards the shore are not strong enough to transport this sediment back to the island, resulting in erosion of both ends of the island, and its eventual disappearance. The location of the Hunting Island Lighthouse on the north side of the island has moved south twice since its construction in 1859 due to this erosion, with the original site of the lighthouse being more than a mile north of the current northern extent of the island!
Due to their ephemeral nature, barrier island are not ideal for development. Most barrier islands have extensive engineering structures and beach replenishment programs in order to restrict their movement. These measures are more of a delay than a solution, and often have unintended consequences. By retaining sediment in one area other areas are starved, and by continuing to develop areas that would be underwater without artificial controls, the inevitable flooding and beach loss are delayed and worsened.
Groins and jetties are two common structures used to control sediment transport along the coast. Groins are barriers constructed perpendicular to the coastline to restrict longshore drift. Sand piles up against updrift side of the groin, while the downdrift side is starved of sand and erodes away. In order to counteract this beach loss on the downdrift side, another groin is emplaced, resulting in an inwardly curved coastline and eventual beach loss at the termination of the groin sequence. A groin sequence is present along the beaches of Hunting Island, and can be seen below. Jetties are similar to groins, but emplaced adjacent to tidal inlets to stabilize the inlet and keep it from migrating.
Groins along the beach. Note the sand piling up against the updrift side and being starved from the downdrift side in the first image. Note the concave coastline created by the groins in the second image, with the large inward erosion curve at the northern tip where the groins end.
The temporary nature of barrier islands is evident at the southern end of Hunting Island, where natural processes have not been interfered with. The lagoon was breached by Hurricanes Matthew (2016) and Irma (2017), cutting off the southern tip and creating Little Hunting Island. When we visited in June of 2022, the breach was actually partially filled in with sand, turning Little Hunting Island back into a spit. The breach will likely be reestablished with hurricane season coming soon, turning it back into an island. Breaches are not created by overwash during the storm event, but by backwash after the storm. The water level in the lagoon rises during the storm, eventually overtopping its banks and flooding over at the path of least resistance, breaching the spit and creating an island.
Little Hunting Island. Note the sand in the second image separating the lagoon breach, making Little Hunting Island a spit rather than an island.The breach in the lagoon. As the lagoon breaches to the north, more barrier islands will be created.
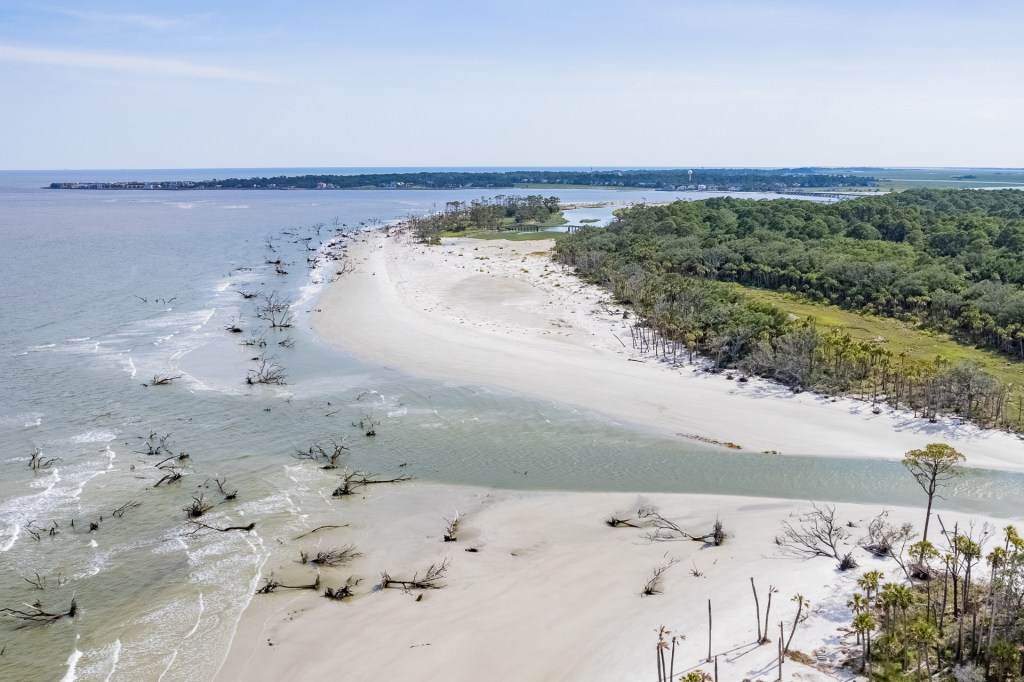
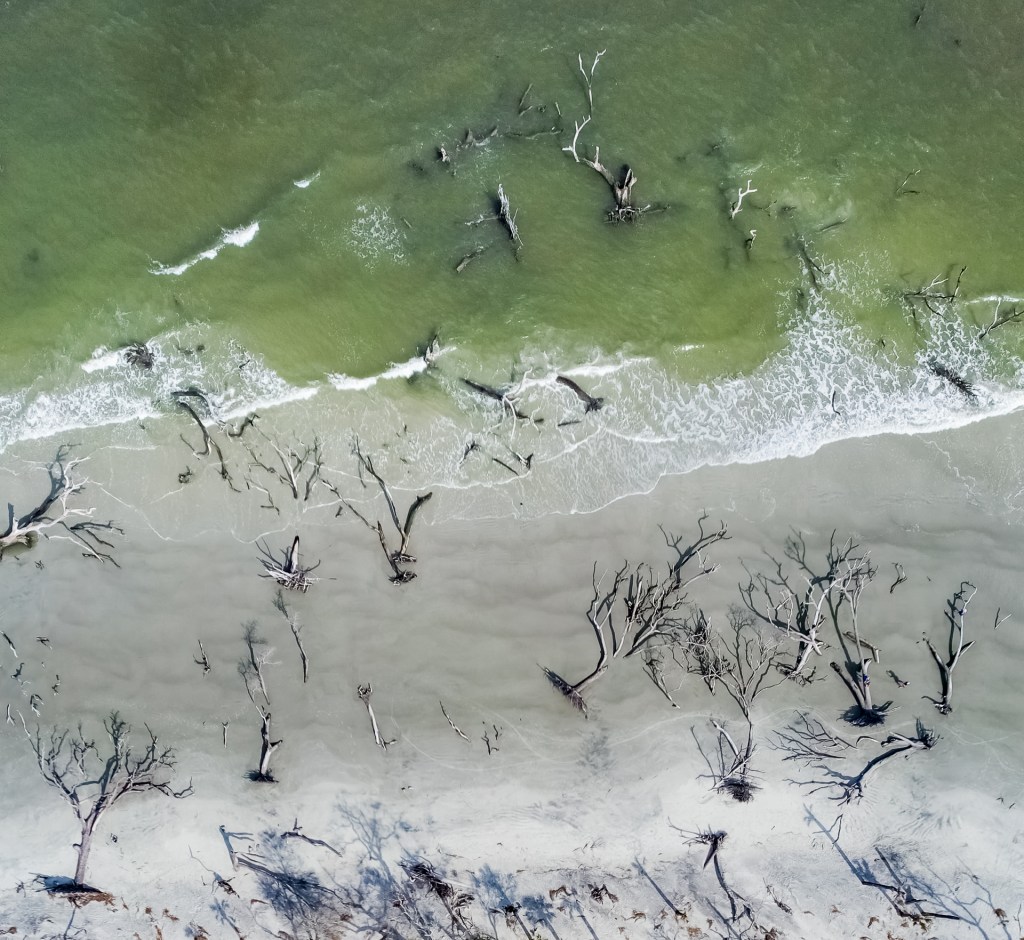
One of the most striking features of erosion on the island can be seen in an area called Boneyard Beach on the southern tip. As the beach has eroded away and the sea has crept up the shore, saltwater has choked the life out of the trees behind the beach. These trees, with their dead roots, are then toppled and strewn about, creating a “boneyard” of these denuded giants.
The dead trees of Boneyard Beach.The dead trees of Boneyard Beach.
Shoaling to the south of the island along the inlet, showing shallow depths where the island recently extended out to.Flying the drone while my wife Miriam marvels at patterns on a tree trunk.
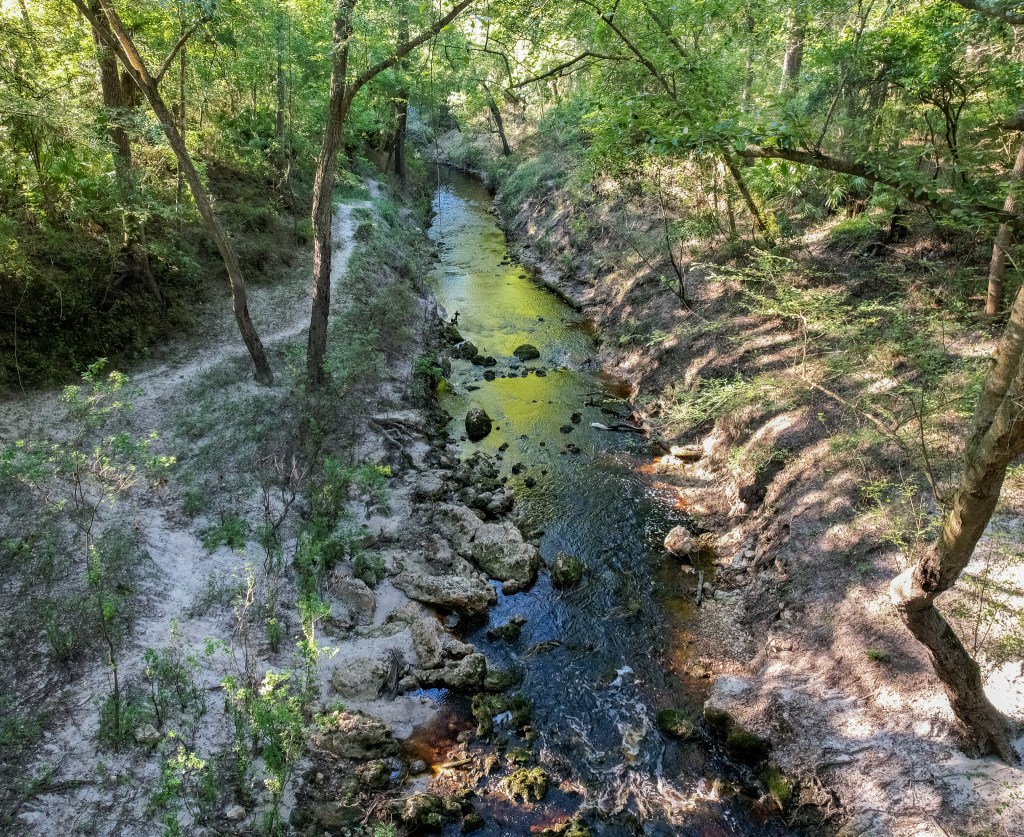
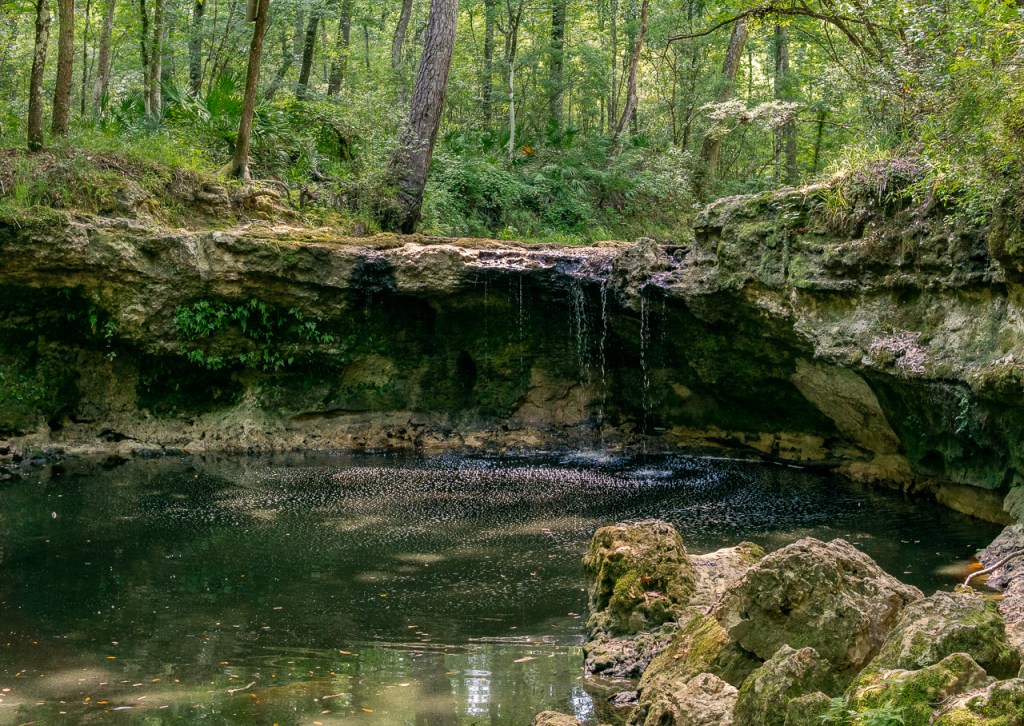
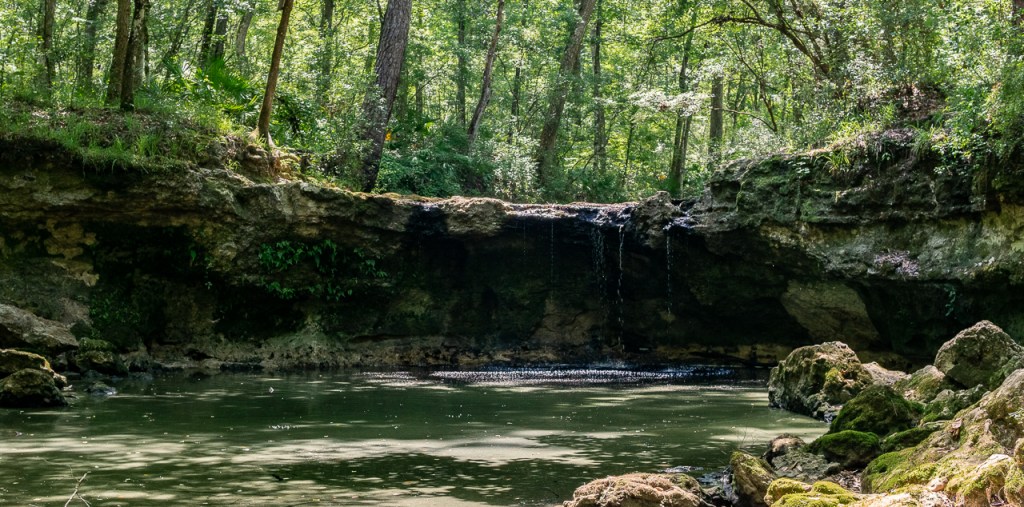
I returned to the falls in early June, hoping to capture some different perspectives with my newly acquired drone! I received my Part 107 commercial drone license in March and had been very eager to get my hands on a working drone to finally fly. The falls were running strong but clear with a relatively low sediment load, indicating primarily subsurface input rather than runoff carrying sediment. This occurs when rain recharges the aquifer, but enough time has passed since the rain event that overland runoff heavy with sediment has slowed. Precipitation that has infiltrated into the subsurface of the drainage basin feeding the creek now dominates, its water less sediment-laden due to filtration through the soil and soft bedrock. The level of the creek is still fairly low at the start of summer and the heavy rain it brings.
Note the channel position, well-defined contact between the more resistant “cap” limestone layer and the less resistant underlying layer, and the heavy erosion exposing tree roots along the steep banks of the creek.
Close-up of the falls. Note the potholes forming above and adjacent to the main course of the waterfall. Coarse sediment is spun around by eddies, grinding against the channel bottom in a circular motion and creating a pothole shape.Downstream of the falls.
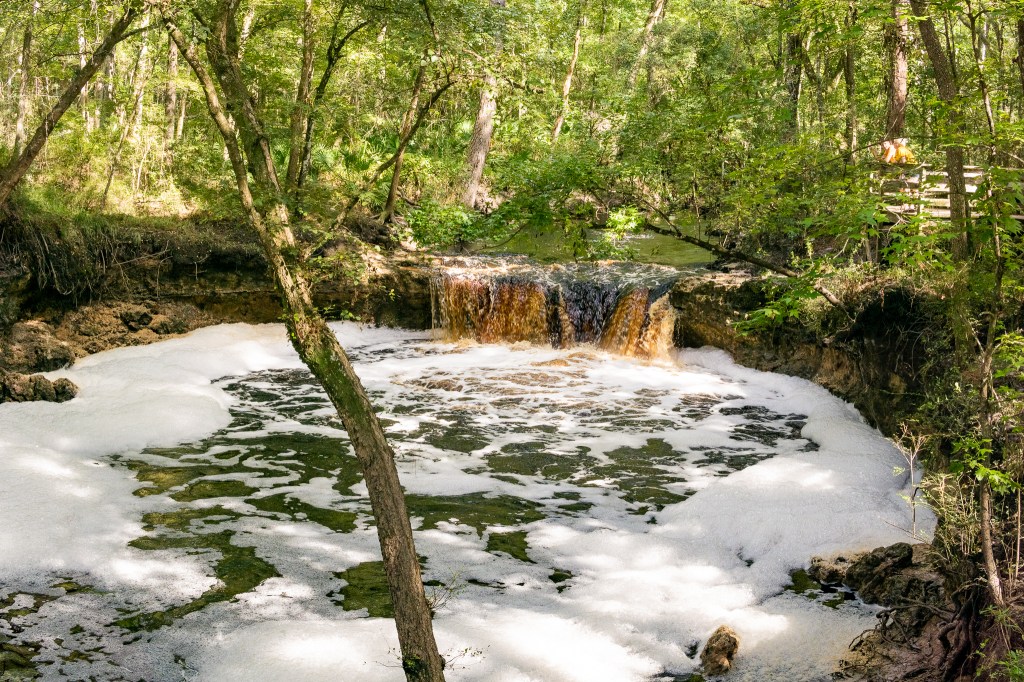
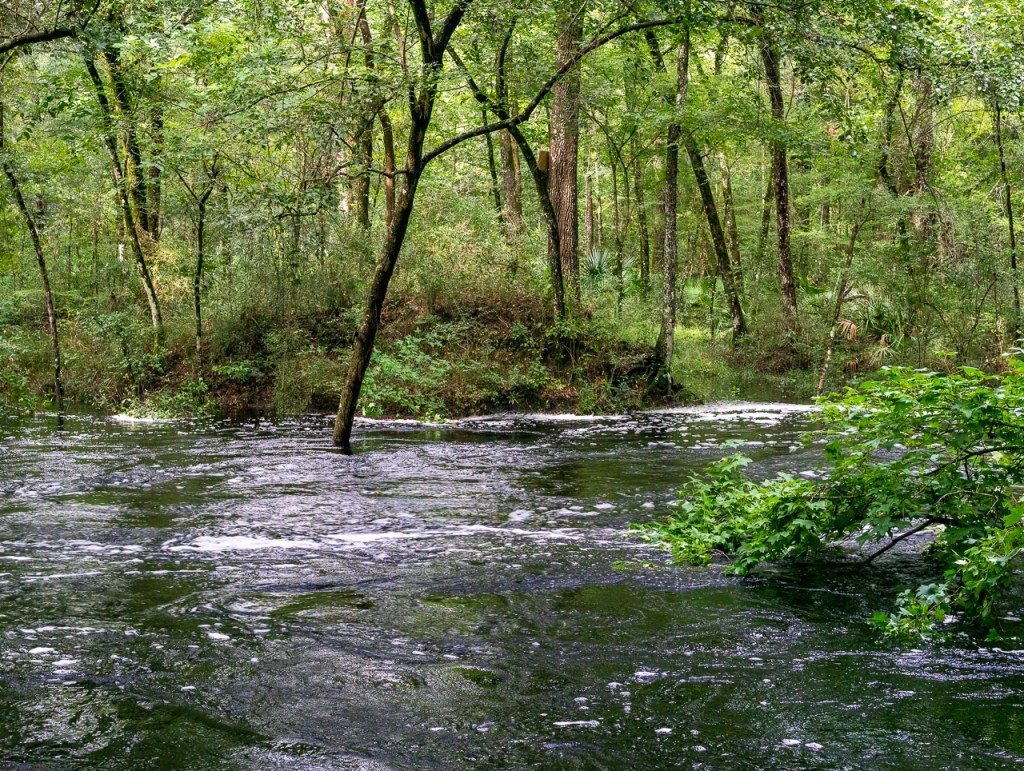
I visited the falls in late September, and the creek was running strong and high with very turbid discharge. Turbidity is the measure of the clarity of the water, indicating the level of suspended solids such as clays and silts. An increase in turbidity is most often seen after heavy rains, as surface drainage flows into the stream, carrying sediment eroded from the land surface.
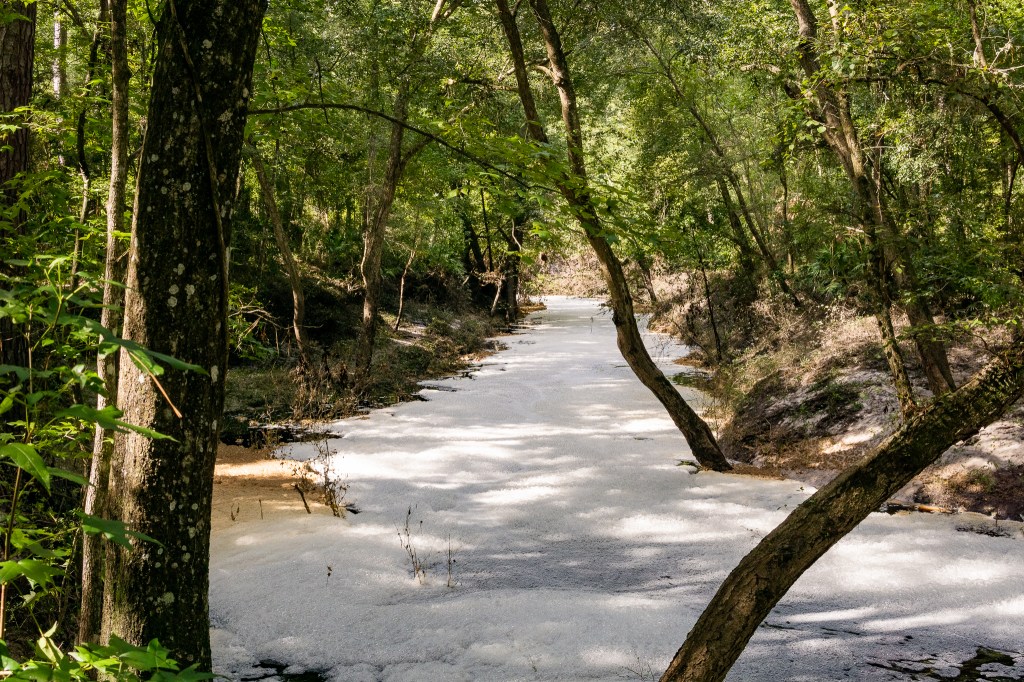
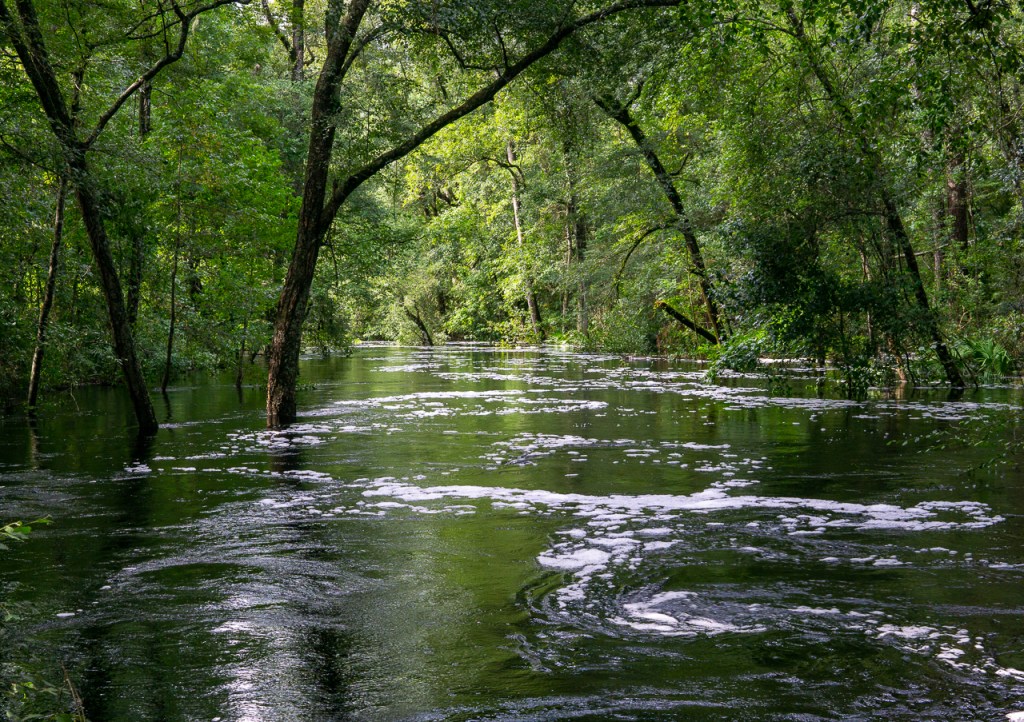
The falls running heavy with sediment load, note the brown tea color and foaming. The water level is high, running just a few feet below the rim of the falls.Very heavy foam at the base of the falls, a phenomenon I had never seen before. The foam is caused by dissolved organic matter deposited into the creek by increased sediment loads. The DOC is a surfactant, reducing surface tension, much like dish soap. As the water is stirred up by the turbulent falls, DOC attaches to the bubbles, forming foam on the surface.Heavy foam downstream of the falls in the first photo, and much lighter foam upstream in the second photo. The effect of the turbulence caused by the falls is clearly evident. The light foam upstream is caused by the mild rapids as the creek flows over the line of boulders.Meanders downstream of the park and across NW Falling Creek Rd.
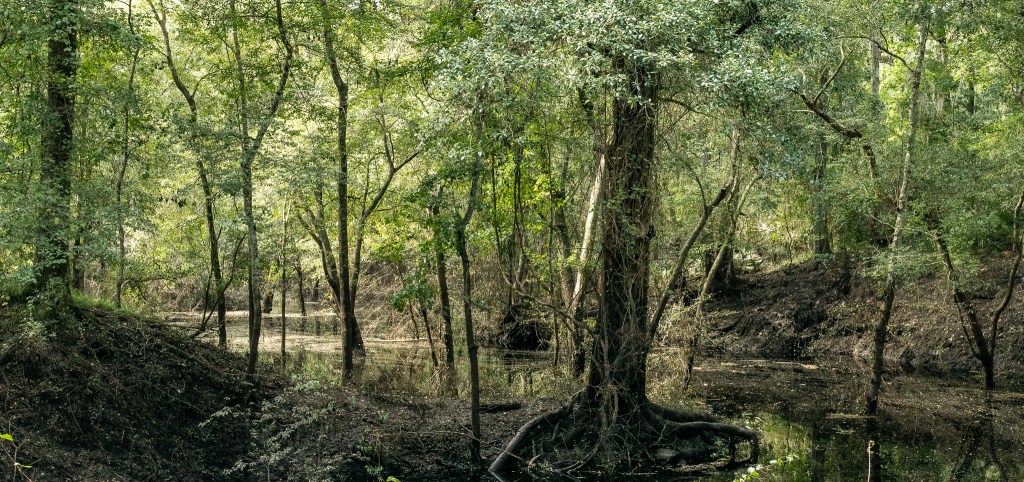
During this visit I tried to find the swallow hole where the creek disappears underground, before reemerging and flowing into the Suwanee River. I left the park and crossed NW Falling Creek Rd, and followed its course north of Dicks Rd. Slashing through the thick undergrowth and swatting away the swarming mosquitoes, I found the creek flowing very slowly northwest through wide, flooded, well-defined meanders, the water nearly stagnant. I eventually had to give up the search as the vegetation became too thick and the banks too steep and muddy. A small boat would have been my best bet to follow the meanders and find where the creek ends.
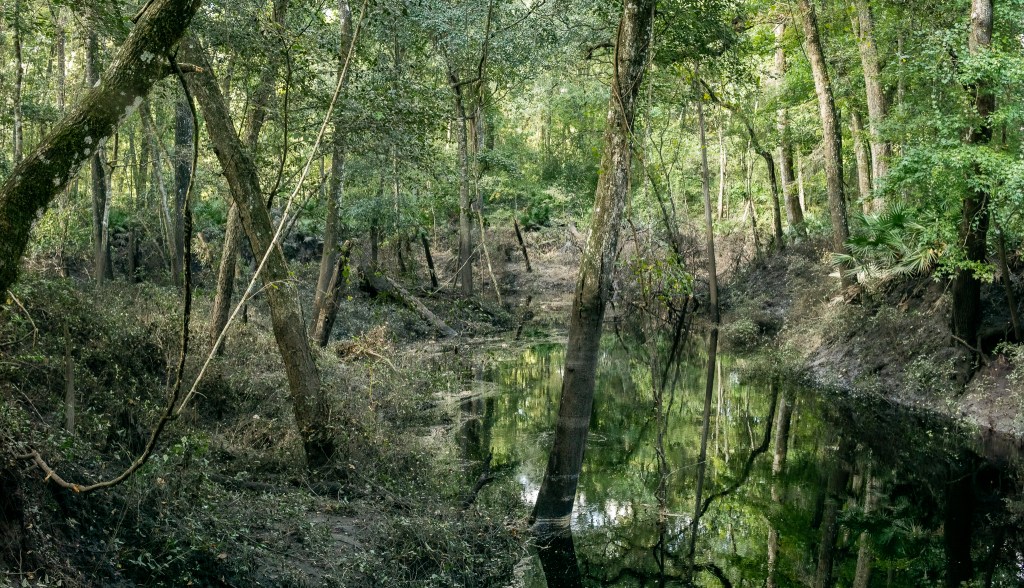
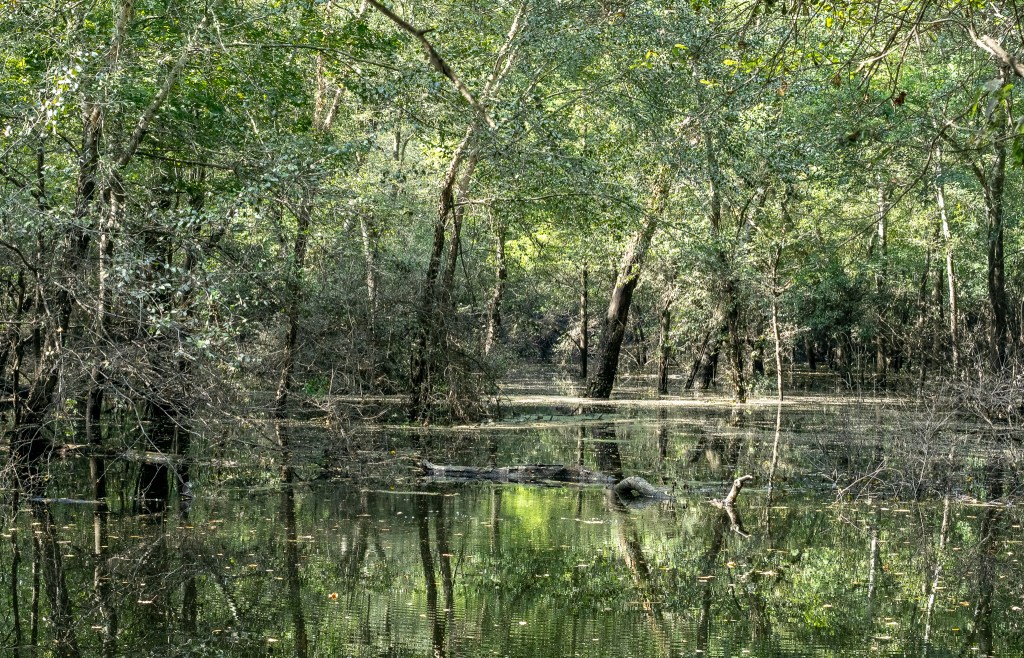
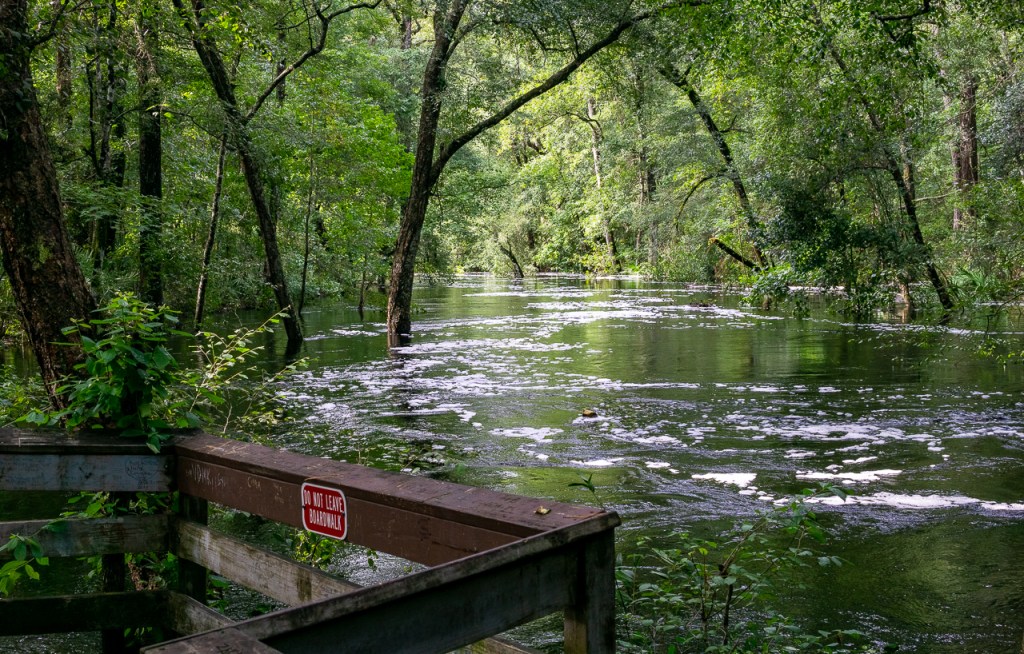
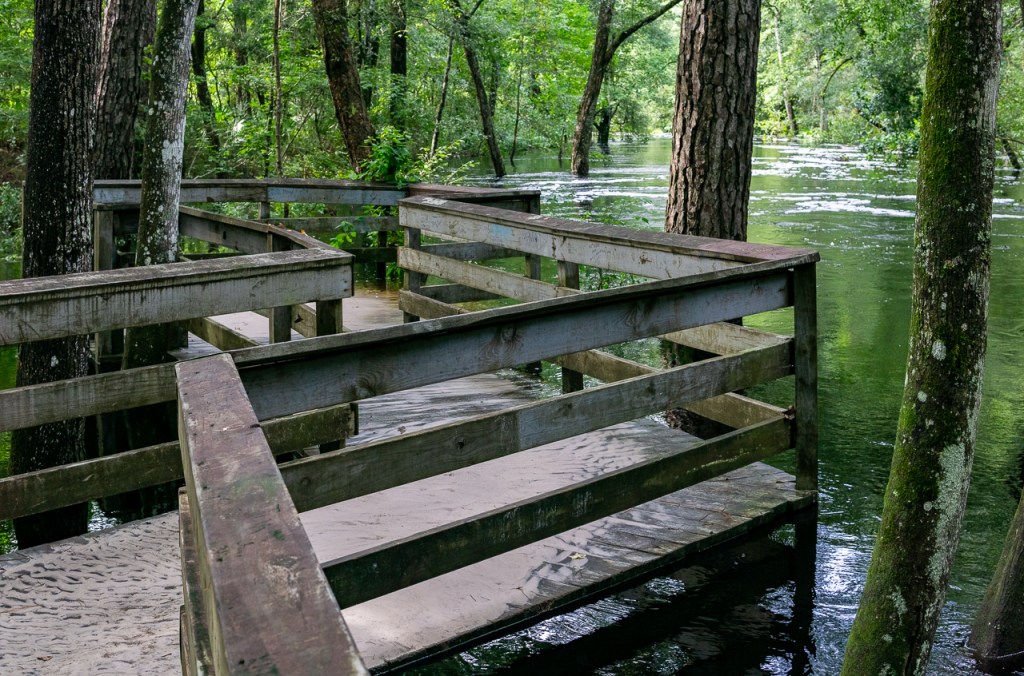
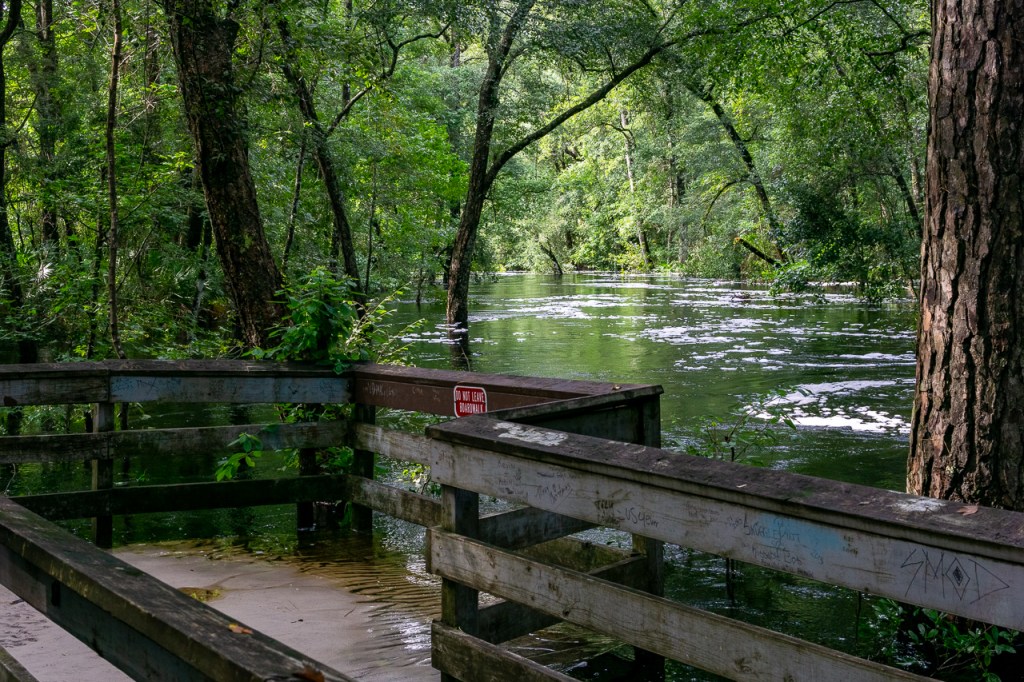
Downstream from the falls after heavy rains in July, the ravine is somewhere down there!The falls completely inundated!Upstream from the falls.The flooded boardwalk, at least 15 feet above the stream bed!
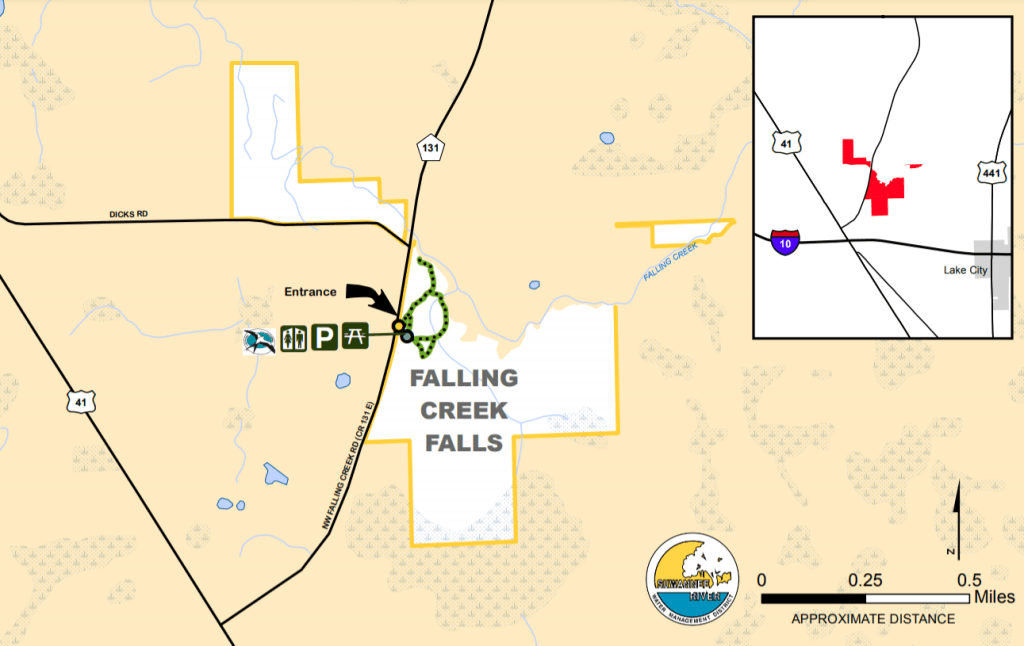
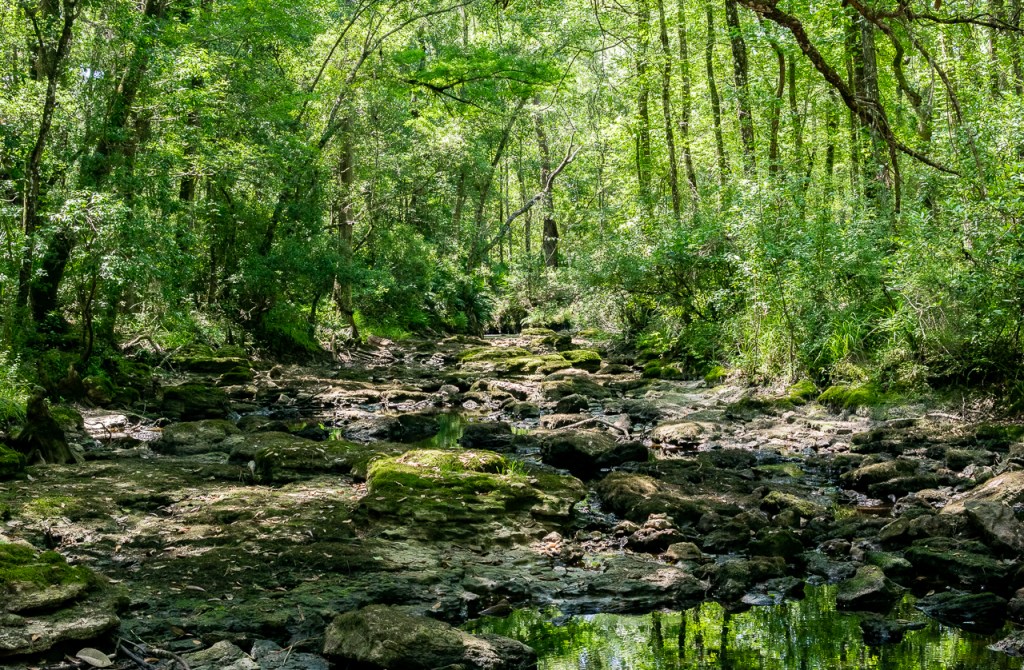
Falling Creek Falls is located in a small county park about a mile north of Lake City in North Florida. The park, nestled in the wooded countryside of rural Columbia County, includes a boardwalk that leads to the falls about a quarter mile down the trail. The creek drops 10 feet over a clayey limestone lip at the falls, and continues downstream through a narrowing ravine. Falling Creek, a tributary of the storied Suwanee River, is an intermittent stream fed by seasonal rain and shallow groundwater from a drainage basin extending to the east. It flows west for a few miles, down the falls, then disappears down a swallow hole in the karst topography, flows underground, then reemerges and joins the Suwanee River to the northwest.
Map provided by the Suwanee River Water Management District.
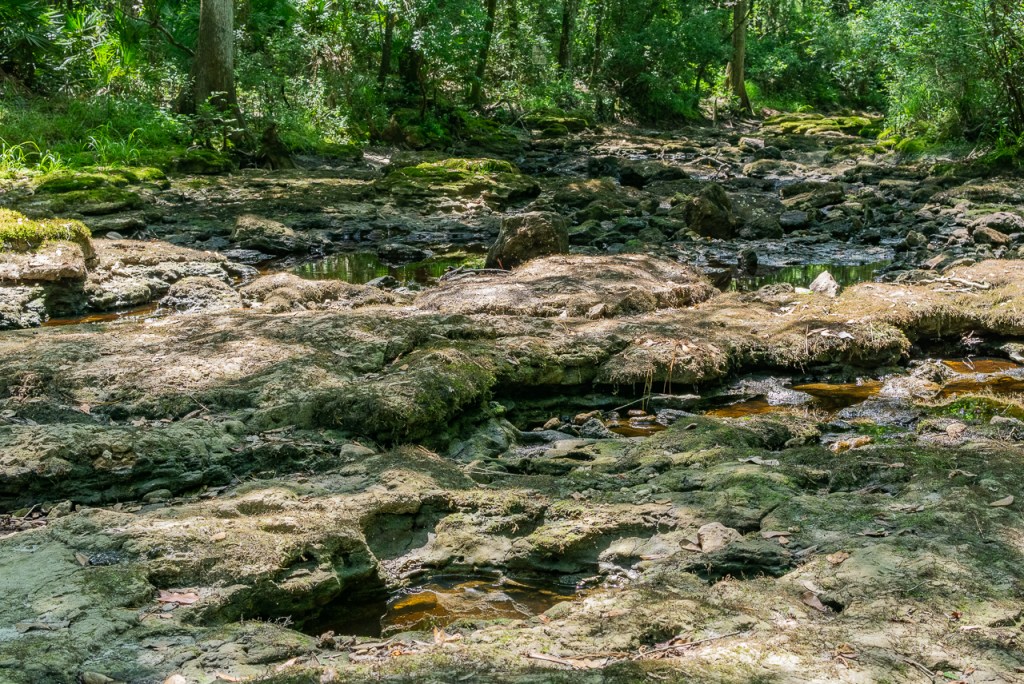
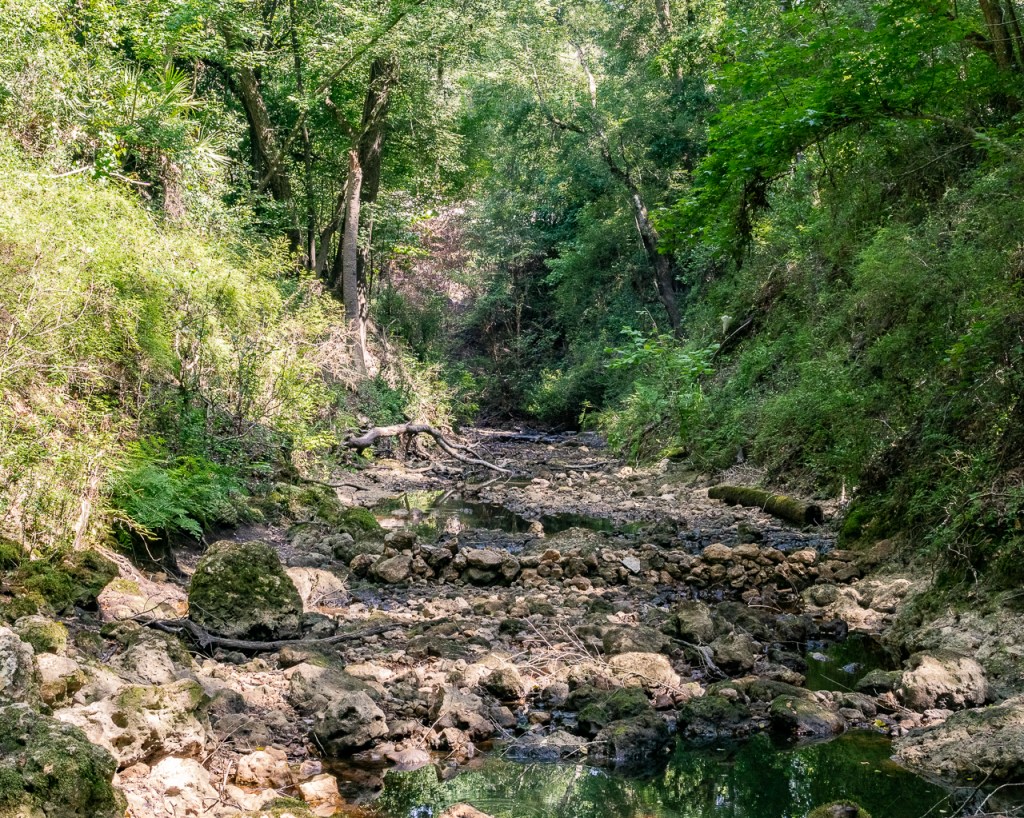
Falling Creek’s water level varies drastically depending on the season and recent precipitation. During my visit in June in the midst of an uncharacteristically dry start to the summer, the creek was mostly dry, with the stream bed fully exposed (perfect for viewing the geology), and barely a trickle coming down the falls. When I returned at the end of a rainy July, the entire creek was flooded above its banks and into the floodplain of the surrounding woods. Water was flowing full and fast above the ravine, flooding the boardwalk. The water level was so high you wouldn’t have known there was a waterfall there!
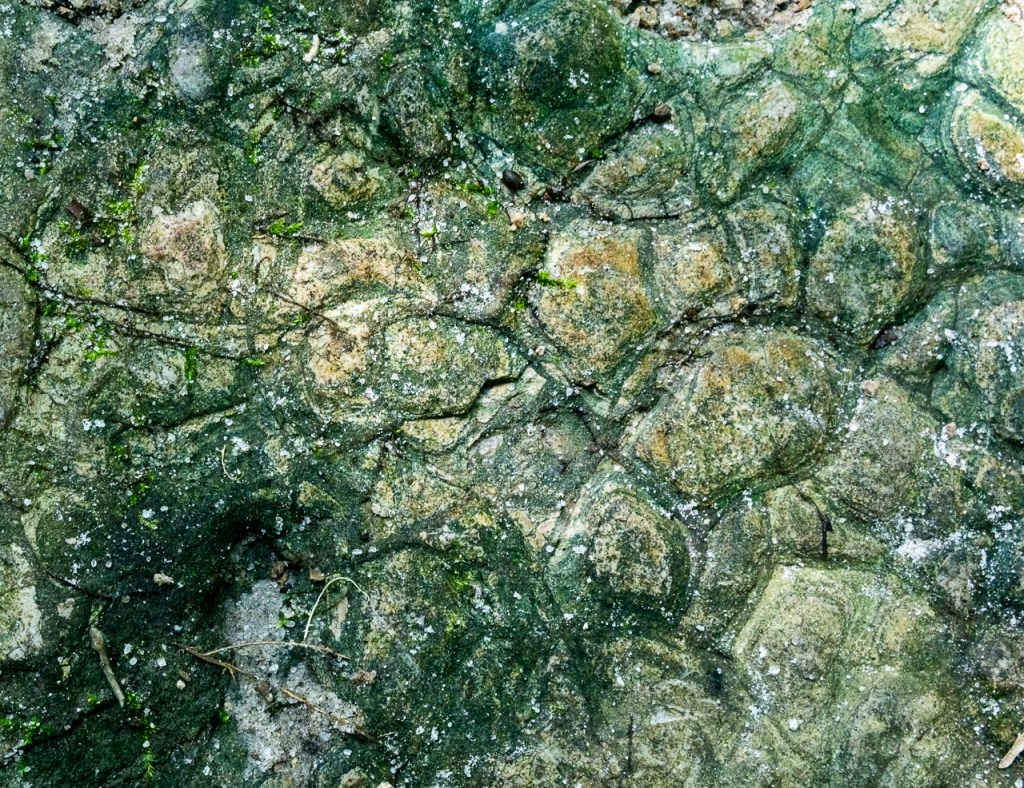
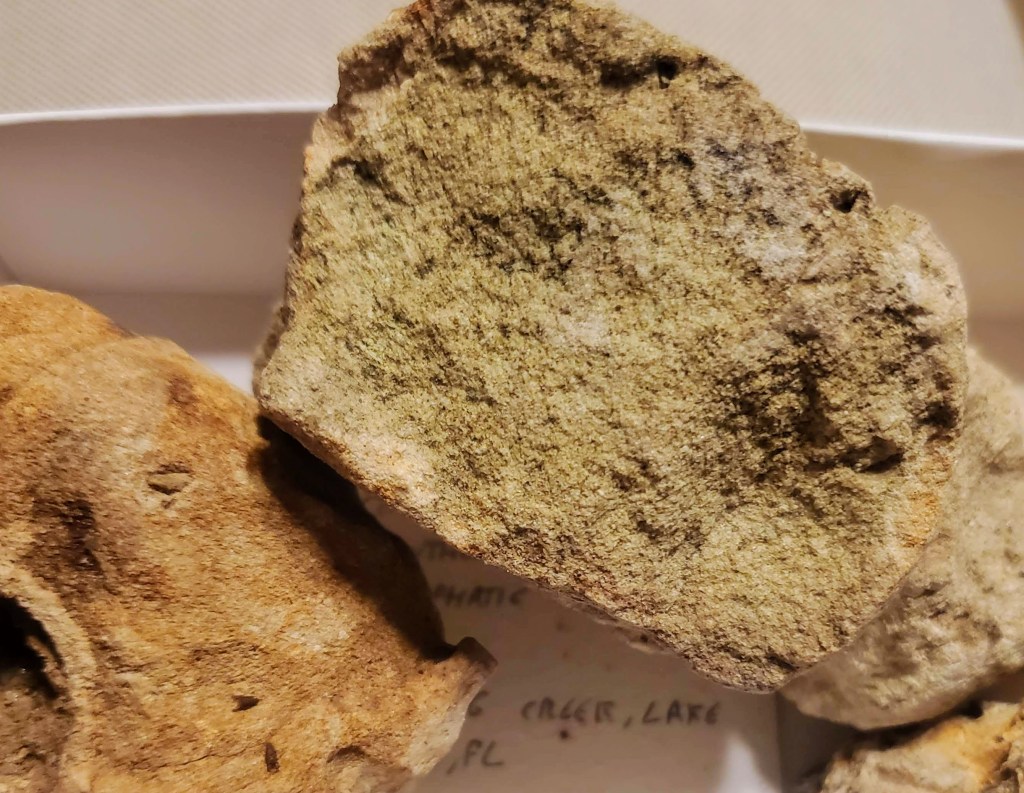
The lithology of the area, exposed at the falls and the stream bed when the creek is dry, consists of the Coosawhatchie Formation of the Hawthorn Group. The Coosawhatchie Formation here is made up of gray-green sandy clays interbedded with phosphatic poorly consolidated limestones and sands. It was deposited during the Miocene Epoch, roughly 5-23 million years ago, in a low-energy shallow marine environment.
Map of the Coosawhatchie Formation’s extent. Noles1984, Public domain, via Wikimedia Commons.
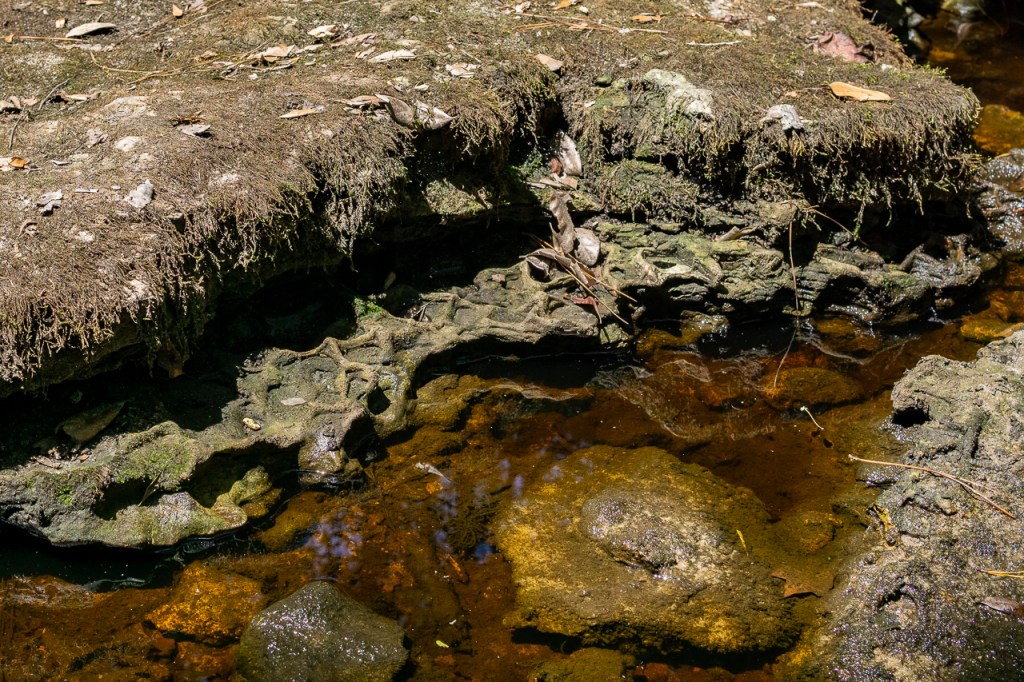
The falls are formed where the denser and more consolidated gray member that forms the creek bottom upstream overlies the softer and less consolidated light green member that make up the lithology downstream. The stream cuts down through the softer layers where it meets them, the flowing water eroding them away. Eventually those softer layers break away to the edge of the more resistant rock, and then continue to get cut away under the overlying resistant rock, resulting in an overhanging lip that water cascades down vertically, a waterfall. The waterfall will slowly retreat upstream as the cycle continues.
Karst topography is very evident in the more consolidated, gray, calcareous stream bed upstream of the falls. Small sinks and fractures are abundant in the clay/rock beds where mildly acidic surface water has dissolved the rock. Moving downstream, the walls of the ravine and plunge pool beneath the falls show the less consolidated gray/green/yellow phosphatic clay/sand/rock beds. The stream bed and banks are lined and littered with cobbles and boulders from these eroded beds. Vegetation covers much of the surface of the ravine walls, showing that the creek often has minimal to no discharge. Karst topography is still present below the falls, but the dissolved sinks and fractures are mostly covered by the boulders and cobbles. About a quarter-mile downstream of the falls, the creek disappears into one of those sinks.
The Coosawhatchie Formation here is semi-confining, the low permeability from the tight, clayey, lithology capping the highly permeable and productive Floridan Aquifer below it, slowing flow in and out. I believe the confining nature of the formation plays a role in the highly variable water level of the creek and its susceptibility to flooding. Surface water from the drainage basin flowing into the creek after rainy periods cannot easily infiltrate through the low permeability lithology that makes up the stream bed, so the water level rises and rises. As it drains downstream it may also encounter a choke point at the swallow hole, the heavy discharge backing up as it tries to flow down the tighter sink, like a partially clogged drain. Increased sediment load from the heavy discharge might clog up the swallow hole, further reducing drainage, resulting in increased flooding of the banks. I would like to visit the creek again and see if I can find a way down to the swallow hole to check it out.
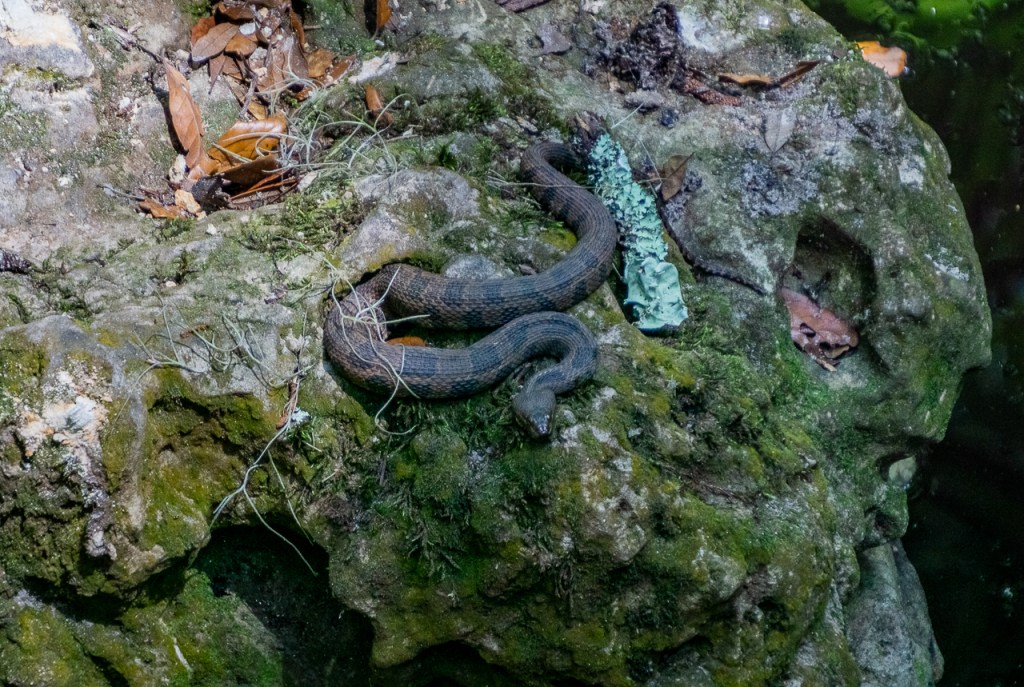
The stream bed upstream of the falls, showing the karst features in the more resistant, gray member. Some excellent sinks and fractures can be seen!Further upstream.Close-up of the textures of the upstream stream bed.A trickle of discharge dripping down the falls. Boulders evident in the foreground, and the contact between the gray, more resistant member and the less resistant, lighter tan-green member is visible a few feet below the drop off. Another photo below the falls.Downstream of the falls, the ravine narrowing as it leads to the swallow hole. Note the linear arrangement of the boulders across the stream bed.A sample from one of the cobbles below the falls. The phosphate here is present as light green sand grains. Florida provides roughly 75% of the United States’ phosphate supply, and 25% of the world’s! Phosphate is primarily used to make agricultural fertilizer, and is mined from the abundant deposits of West-Central Florida. I could not find any records of phosphate mining in Columbia County, it appears the phosphate here is present in too low of concentration and quantity to be economically viable.A surprise on the rocks! I believe this guy is a Southern Banded Water Snake, non-venomous.
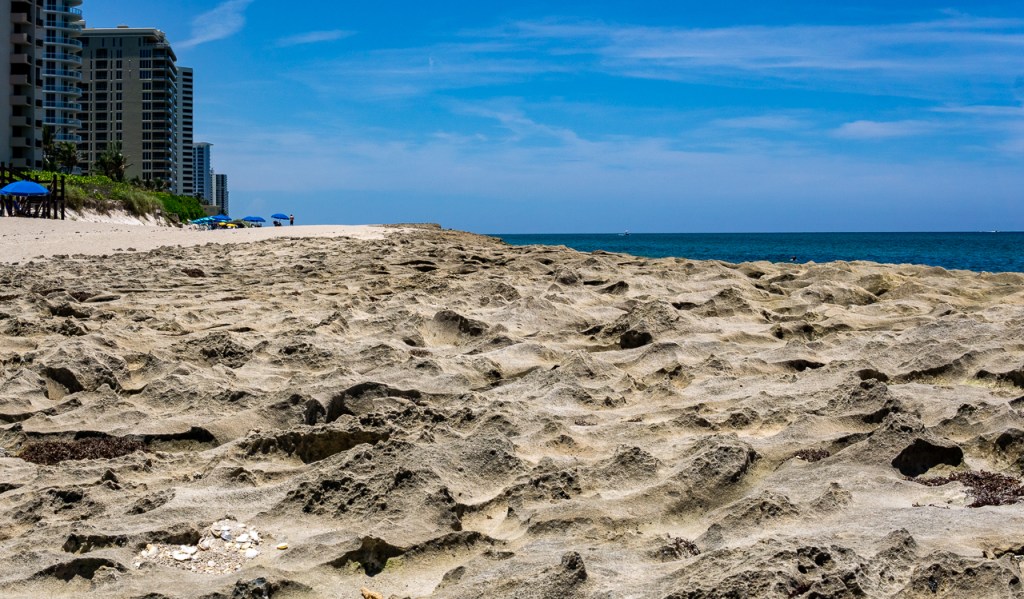
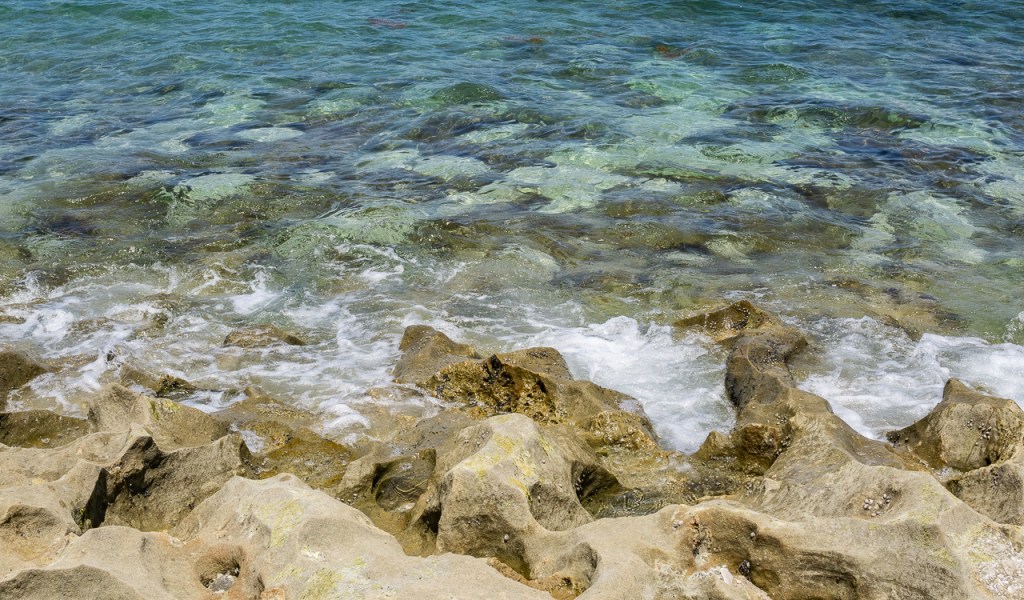
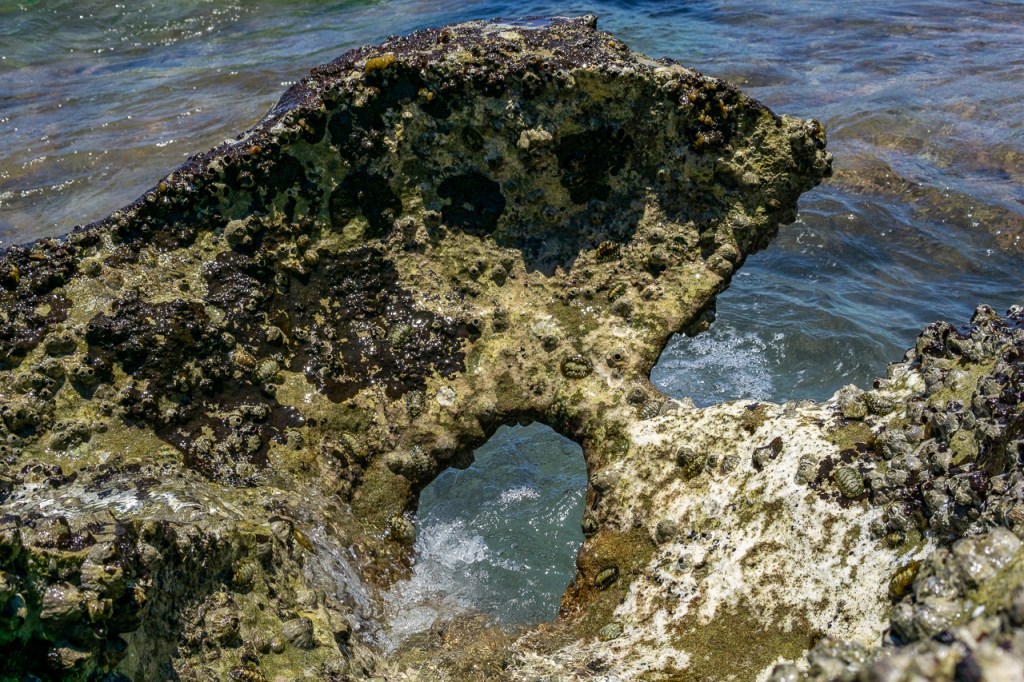
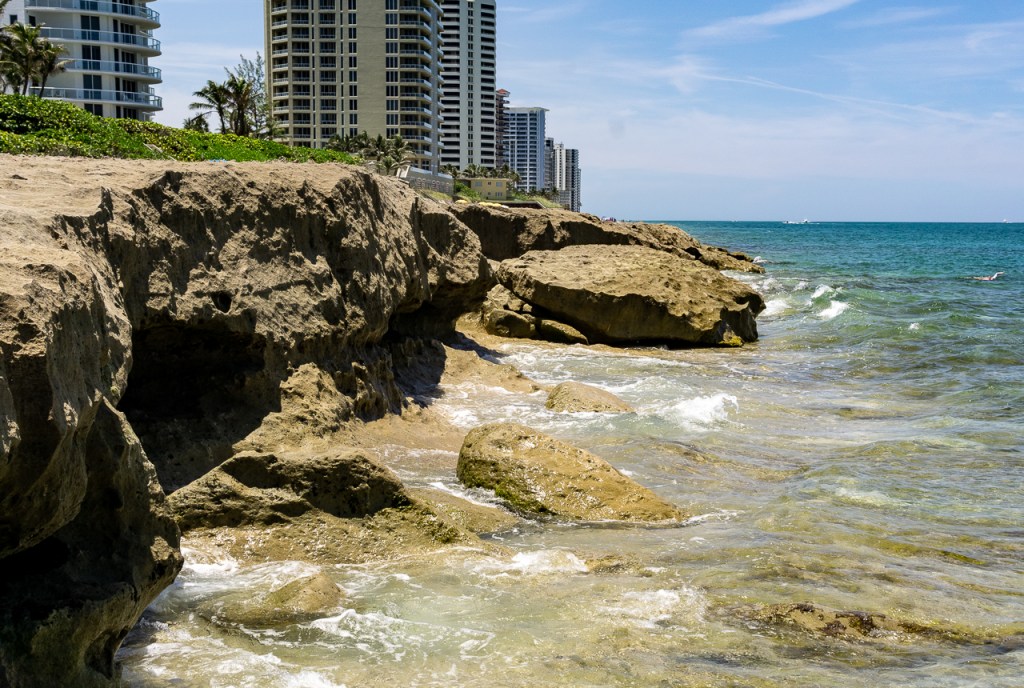
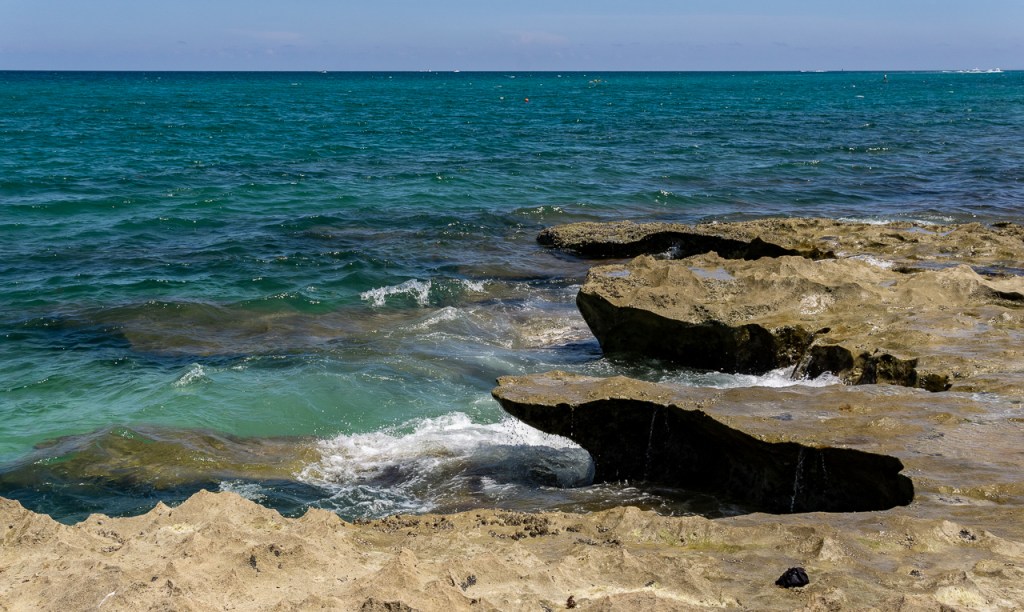
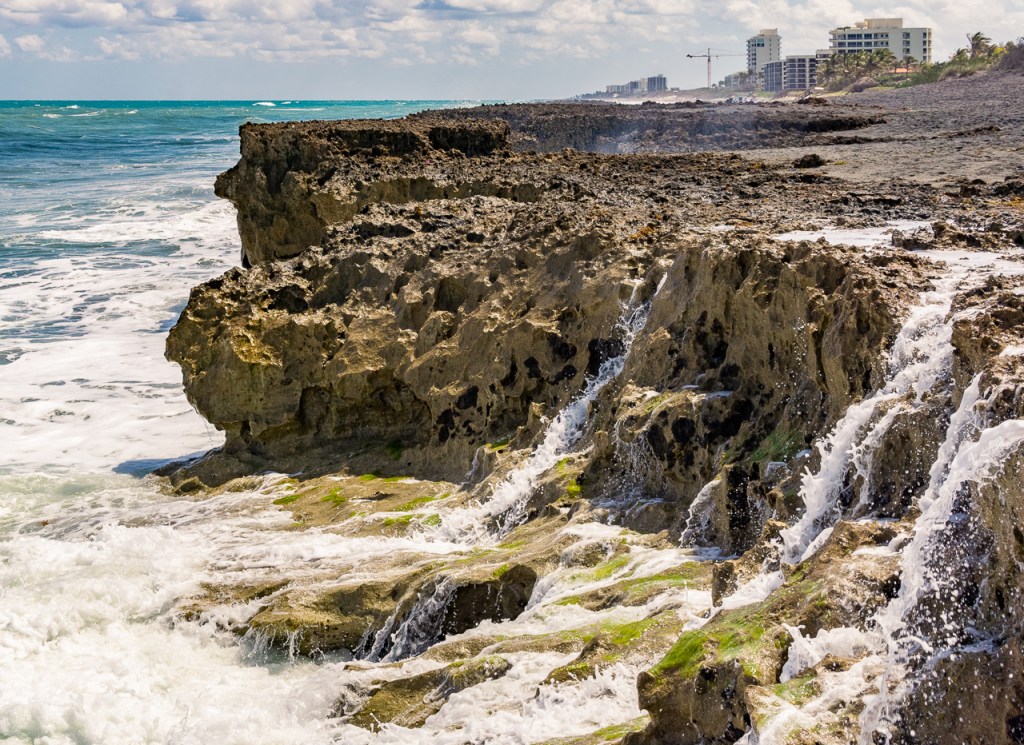
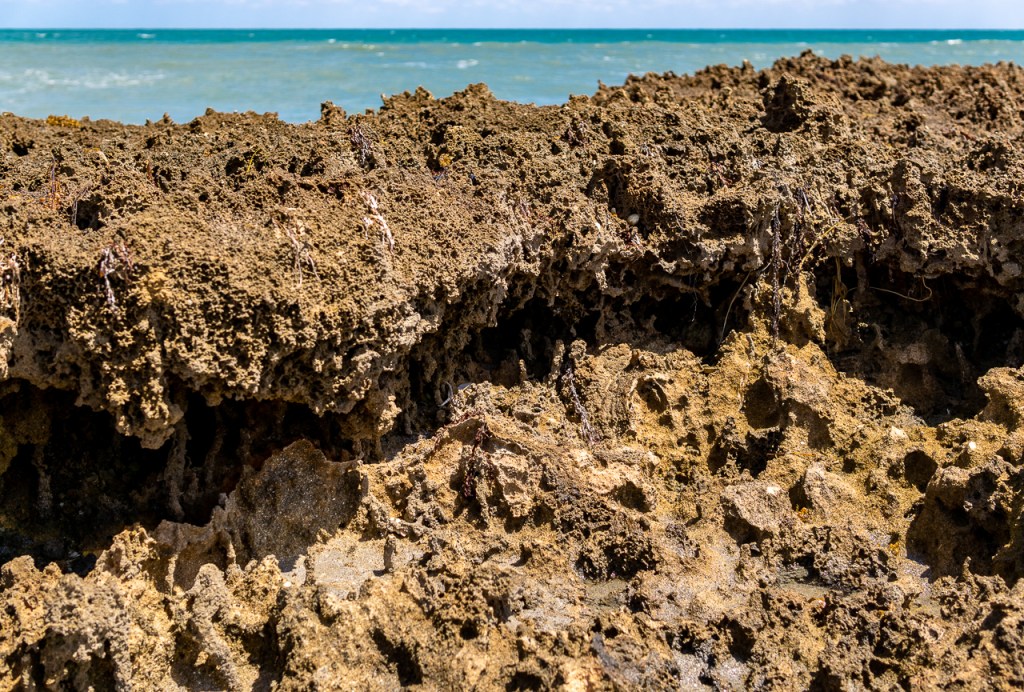
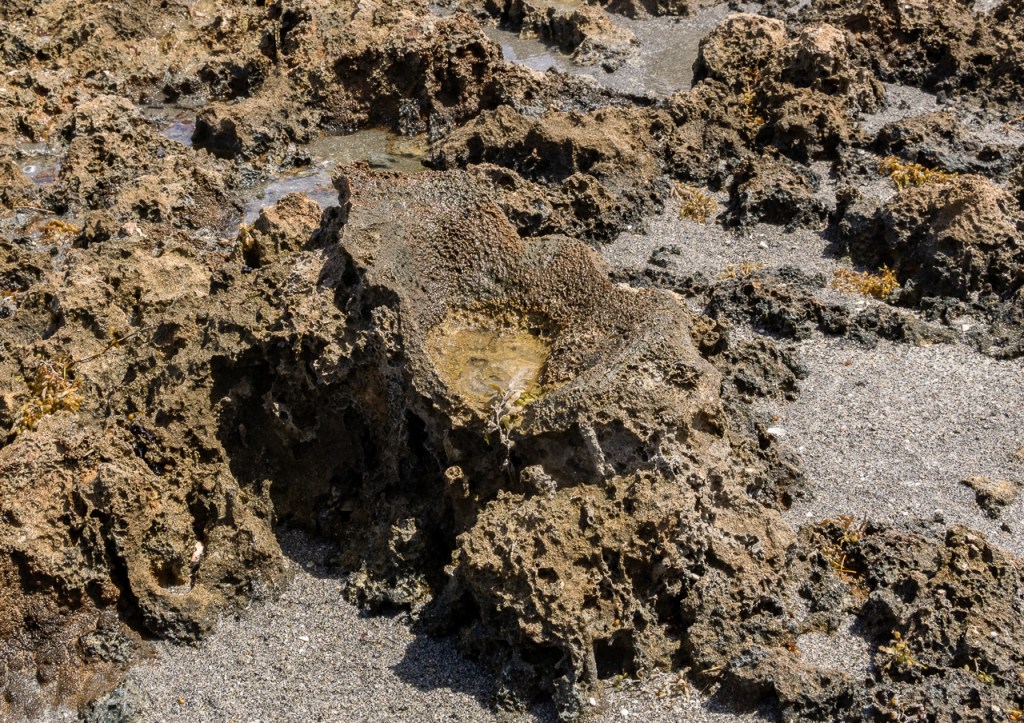
Ocean Reef Park is a beach park on Singer Island, a barrier island/peninsula on the east coast of Florida in Palm Beach County. Like Blowing Rocks Preserve, it also has a notable exposure of the Anastasia Formation. It is roughly 15 miles south of Blowing Rocks. An overview of the Anastasia Formation and map of its extent are in my post on Blowing Rocks Preserve. The Anastasia here is significantly more weathered and eroded than Blowing Rocks. The pockmarked texture is much more rounded, similar to the southern end of the Blowing Rocks exposure where it grades into the sand. The rock appears to consist of more quartz sand grains and less shell fragments, and the shell fragments that are present are finer. The distinctive rod-like bioturbation, so pervasive at Blowing Rocks, is absent here.
The weathered surface of the exposure.
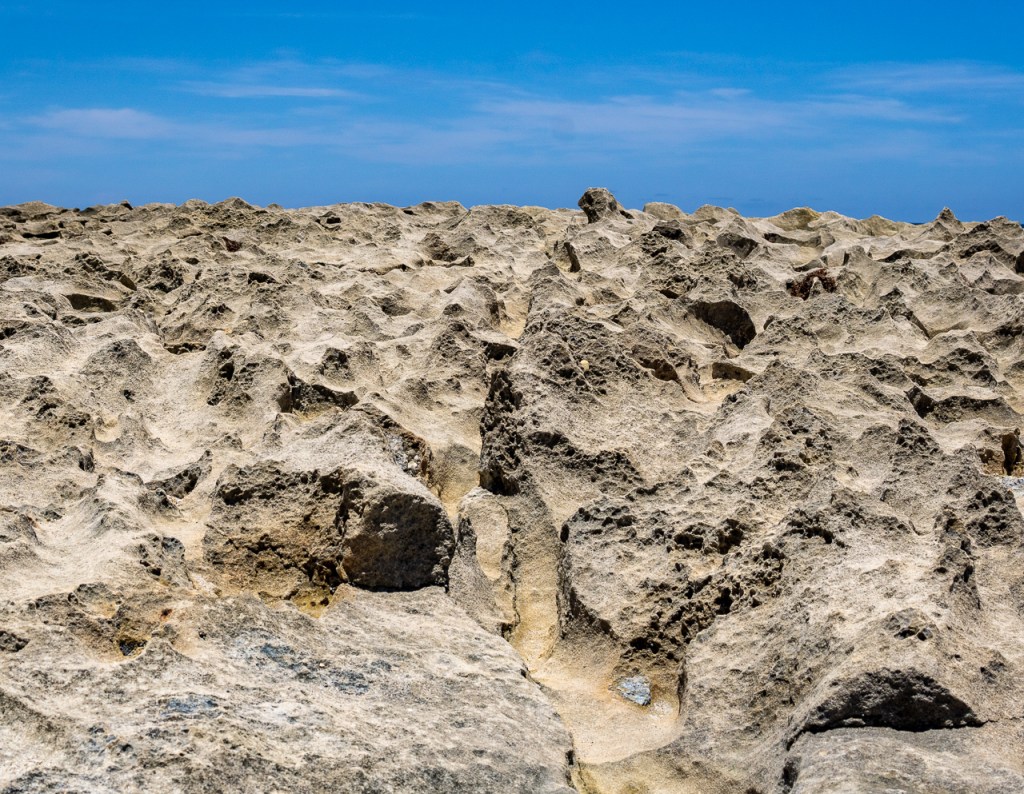
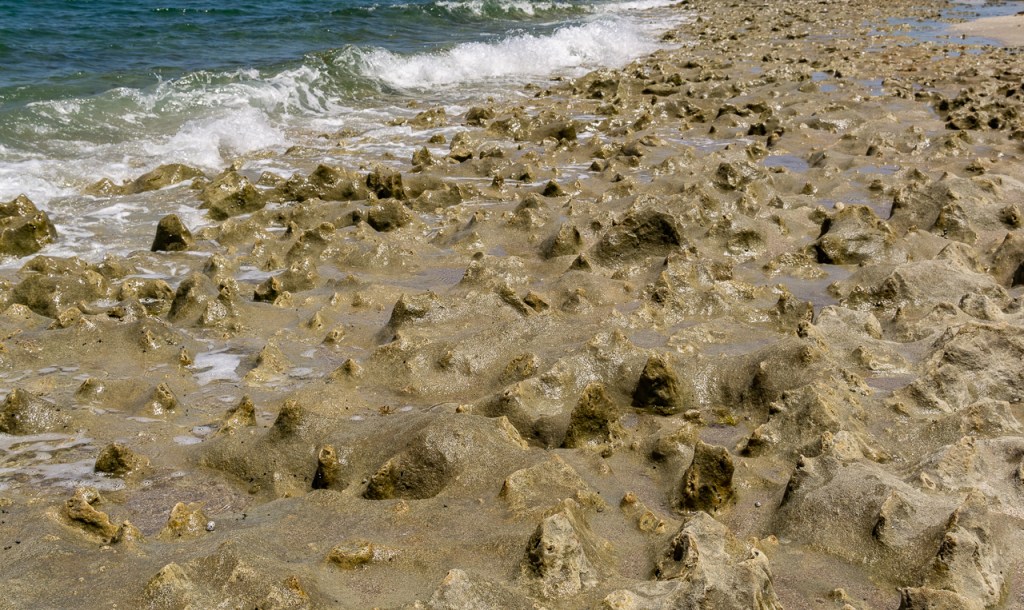
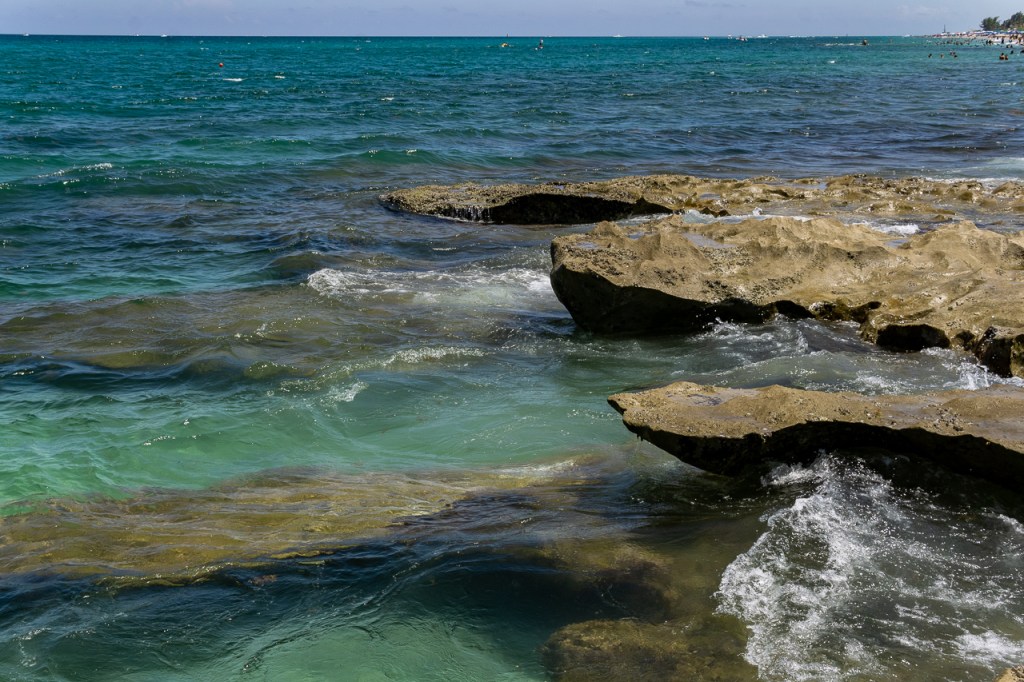
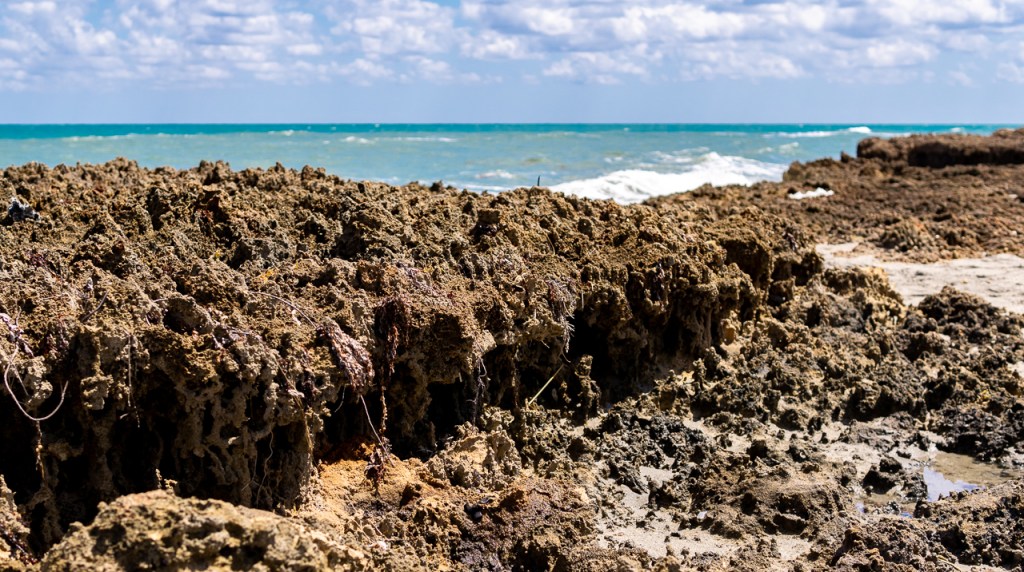
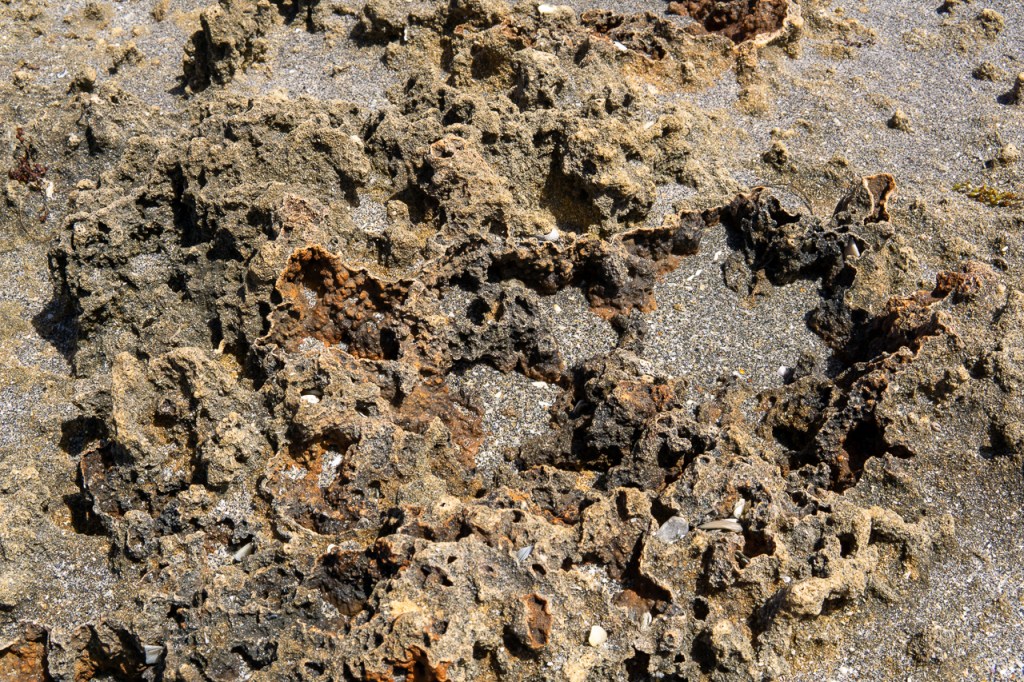
The dissolution pits have expanded, eroding away much of the surrounding rock and leaving only small peaks between pits.
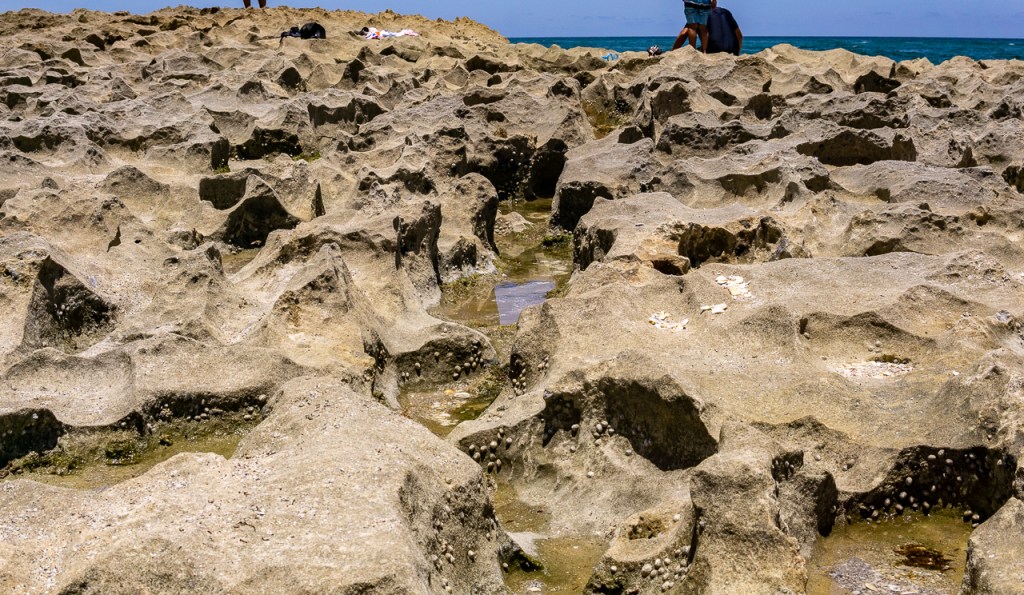
Dissolution pits have eroded out at low points where water collects and flows, forming rills.The exposure grading into the surf, beach sand filling in the weathered pits and rills.
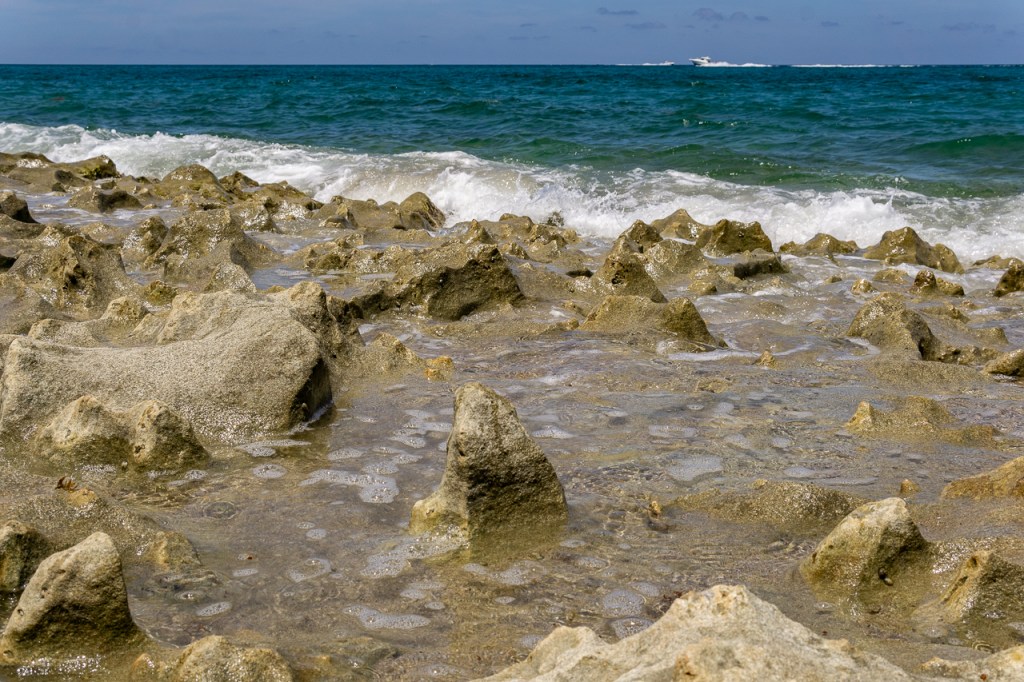
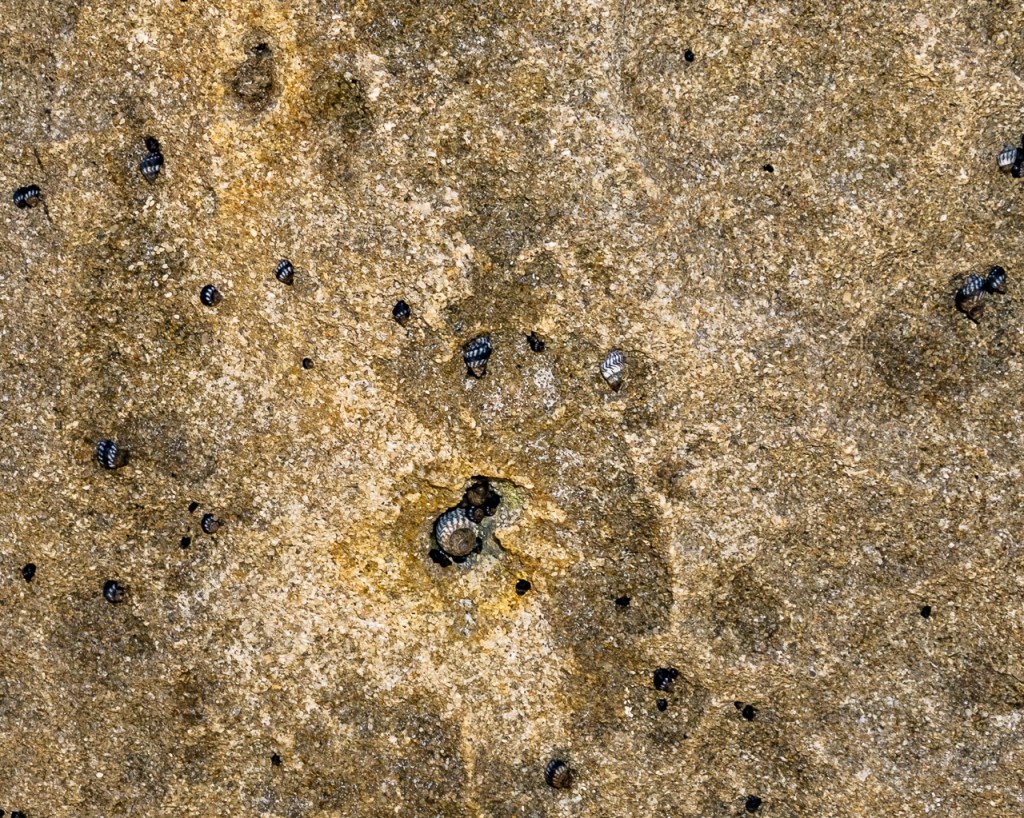
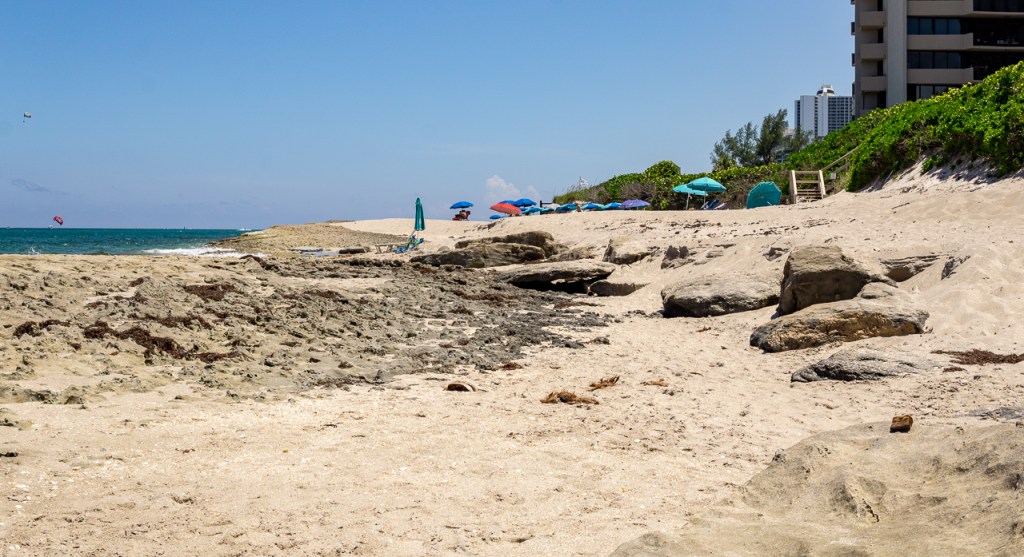
A lower point of the exposure to the north where its surface is at the summer low tide line. Small, pyramid-shaped remnants dot the heavily weathered and eroded surface. A close up of the texture of the rock, showing primarily quartz sand grains cemented with carbonate mud. Life on the rocks.
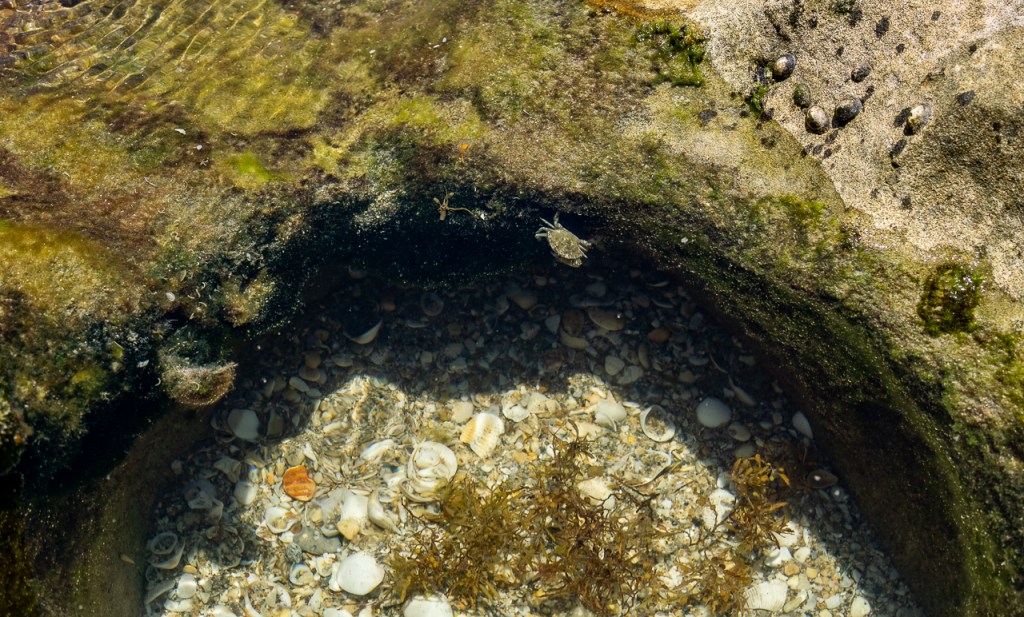
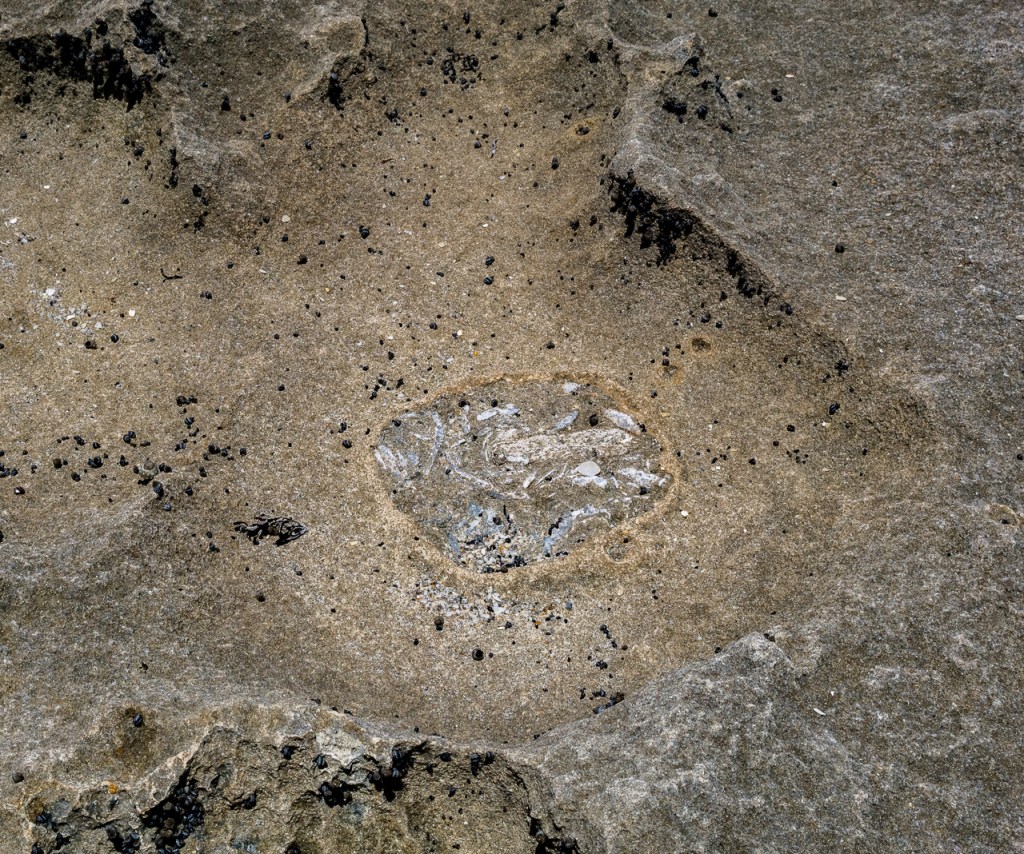
Solution pipes dissolved through the formation.A dissolution pit actively filling with shell fragments. If the fragments sit in the water, will the solution become super saturated and will calcium carbonate recrystallize, cementing the fragments and lithifying into coquina?
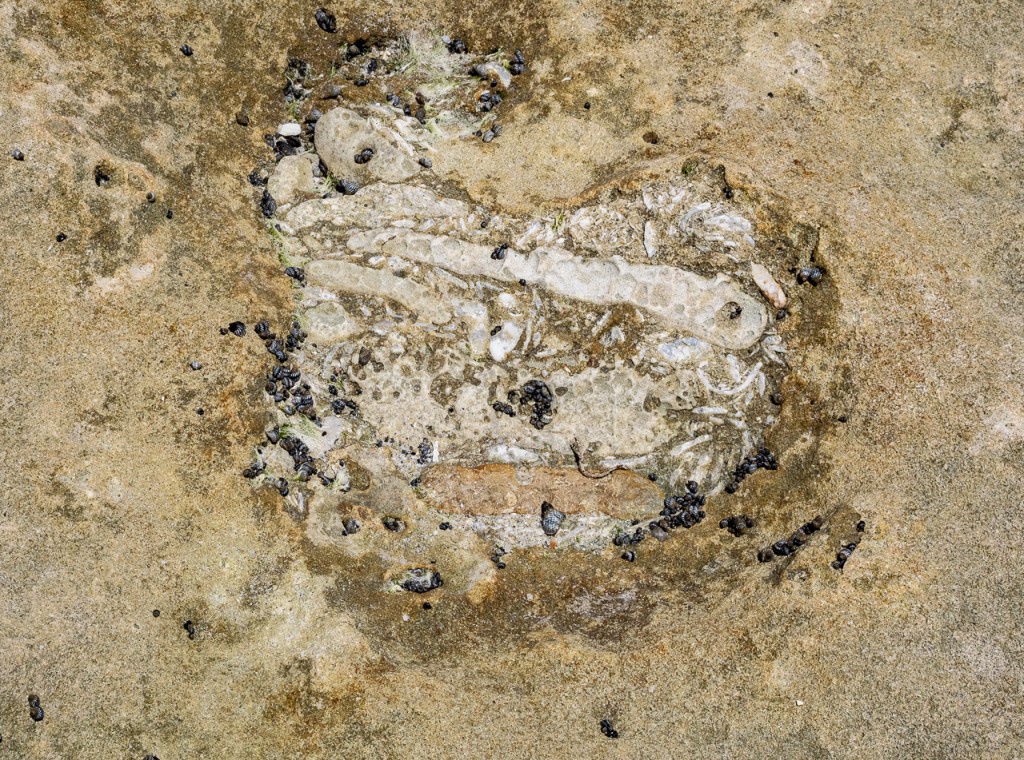
Dissolution pits that have filled with shell fragments, especially oyster shells, then have become lithified by calcium carbonate cement, appearing to answer my earlier question. Would these be classified as actively forming coquina? It’s an interesting feature that I think could warrant further study. The “dissolution pit coquina” seems to be more resistant to weathering than the surrounding lithology.
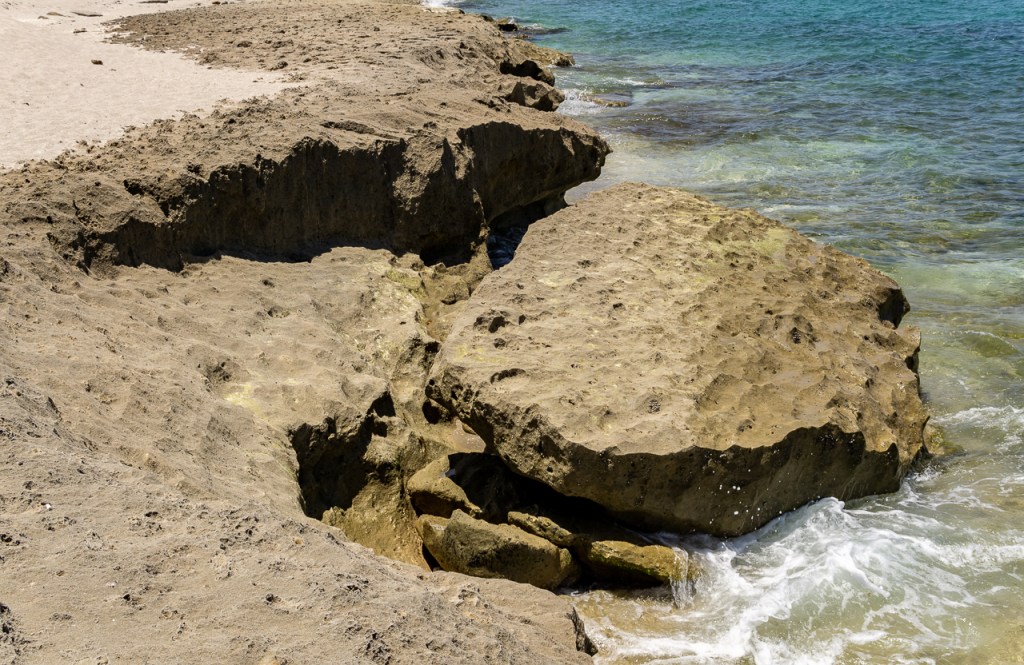
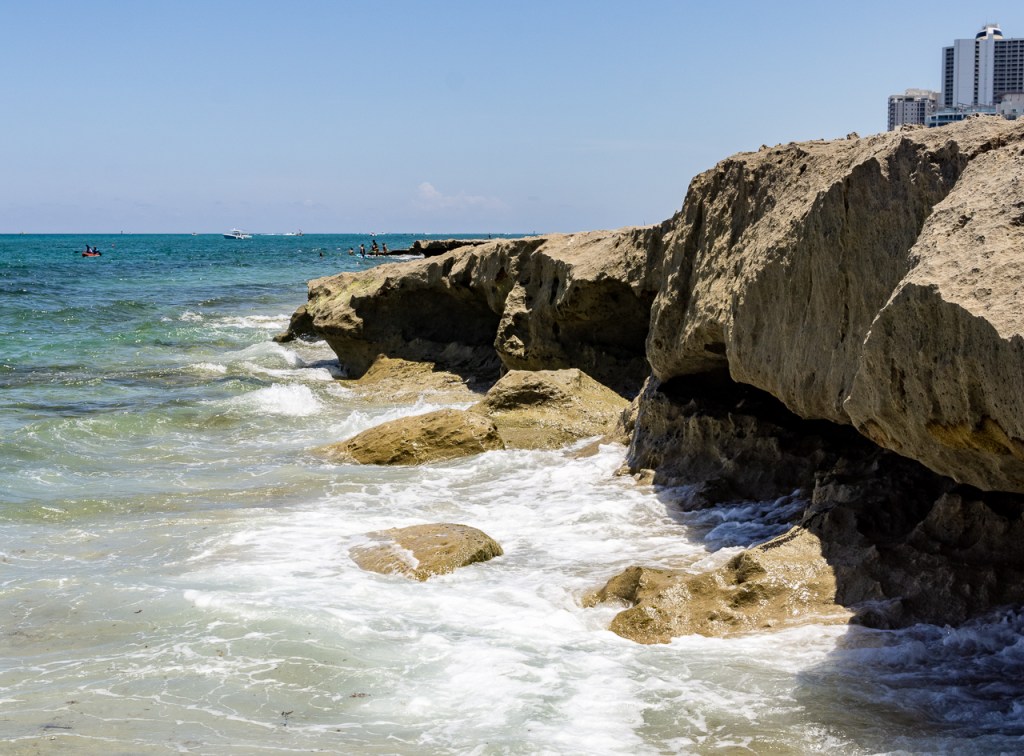
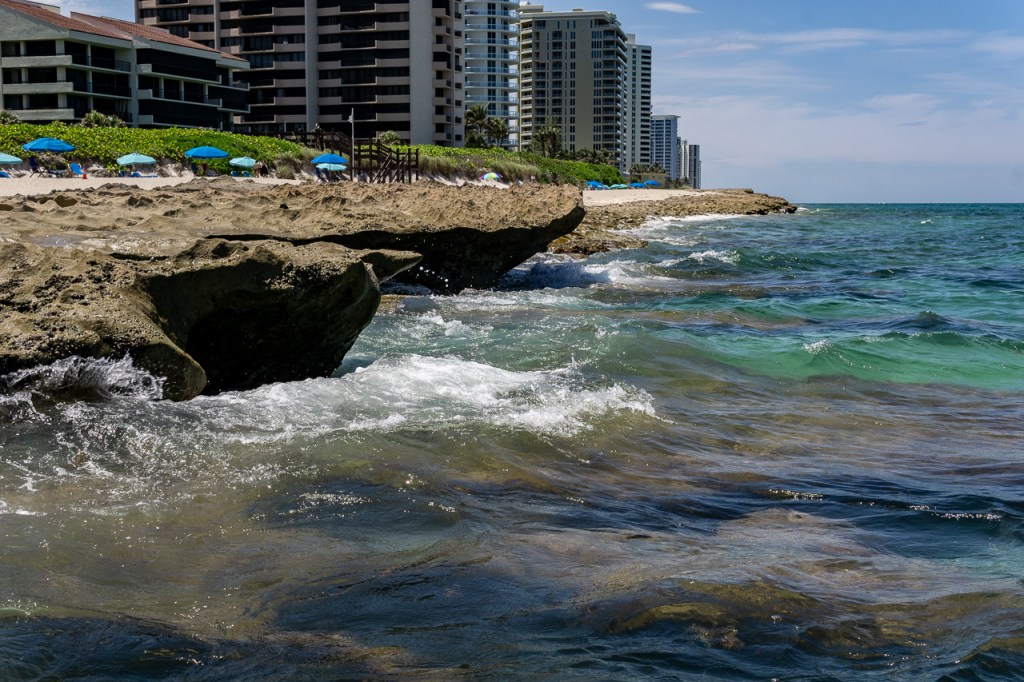
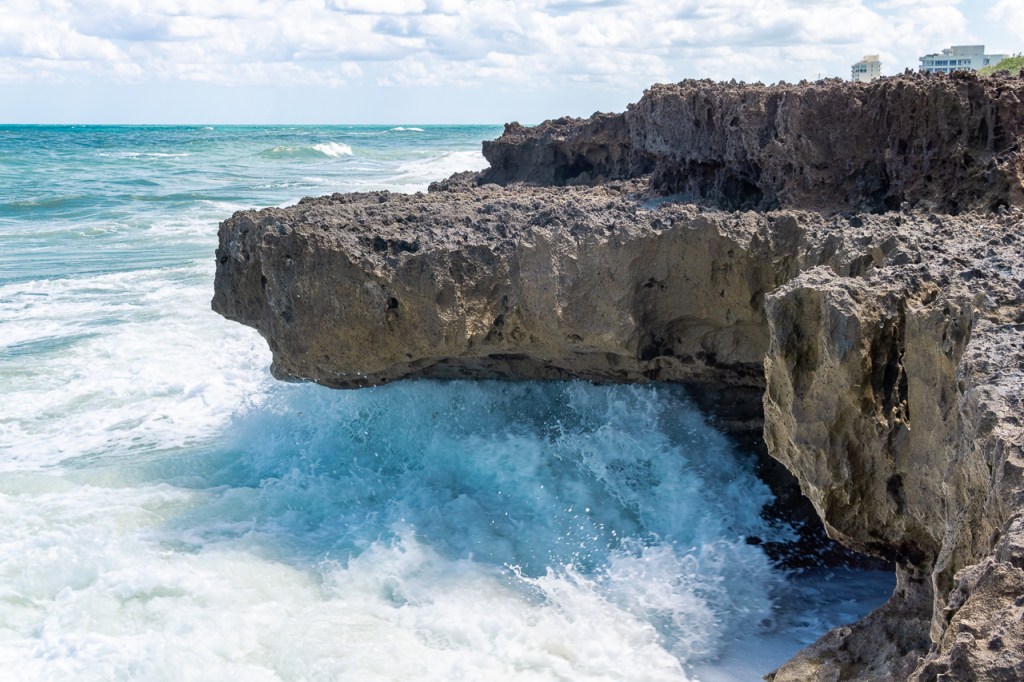
A collapsed sea cliff. The wave-cut notch eroded further and further landward, and the overhanging sea cliff collapsed under its own weight once it lost support.More collapsed sea cliffs in the surf, the wave-cut notch is visible on the right side of the photo.What I believe are boulders from past collapsed sea cliffs on the northern limit of exposure. This line of boulders further landward marks where a past shoreline was, showing a drop in sea level (regression) since that time.
Concave pattern from beach drift erosion and wave-cut notches visible in the exposure above the surface. This concavity can also be seen in the wave-cut platform under the surface as well.
Blowing Rocks Preserve is a publicly accessible beach park on Jupiter Island, a barrier island on the southeast coast of Florida in Martin County. It features the most exceptional and extensive exposure of the Anastasia Formation in the state. The Anastasia Formation is a beach/bar deposit deposited along the east coast geologically recently during the Late Pleistocene. It’s positioned at the crest of the Atlantic Coastal Ridge, stretching from St. John’s County on the North Florida coast down to Palm Beach County in the south. It extends at least 20 miles inland, with its full extent still debated.
Noles1984, Public domain, via Wikimedia Commons
The formation consists of quartz sands and calcareous shell fragments, grading from calcareous sandstone to coquina, a limestone almost entirely composed of shell fragments. Coquina is the defining rock type of the Anastasia. Coquina plays a role in the human story as well, the Spanish quarried the rock to build the Castillo de San Marcos in St. Augustine and other coastal forts in the area. The poorly cemented rock absorbed cannonball blows without much damage to the structure!
The Castillo de San Marcos coastal fort in St. Augustine, Florida. Note the crossbedding still visible in the coquina bricks!
The Anastasia, being limestone, is chemically dissolved by water when it picks up carbon dioxide in the atmosphere and terrestrial sources, formed weakly acidic carbonic acid. This chemical weathering is how the Blowing Rocks got their name. As the rock dissolves it forms holes called solution pipes. Eventually the holes dissolve all the way through the rock, creating a pipe from the bottom to the surface. When waves crash against the coast, seawater shoots up the pipe, “blowing” up to 50 feet high!
Solution pipe dissolved through the Anastasia Formation.
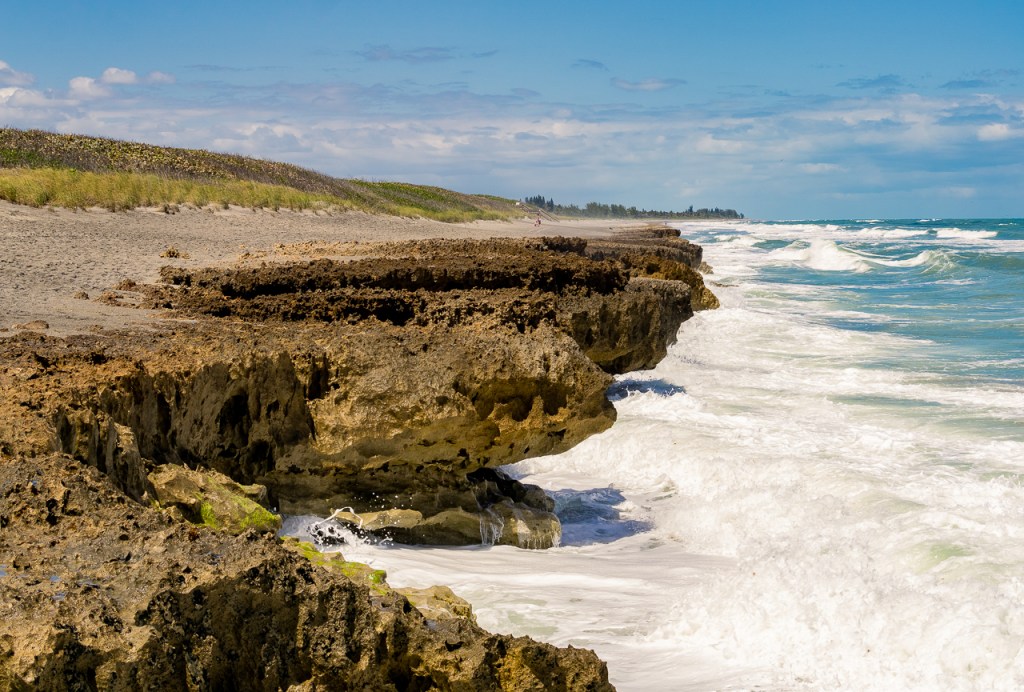
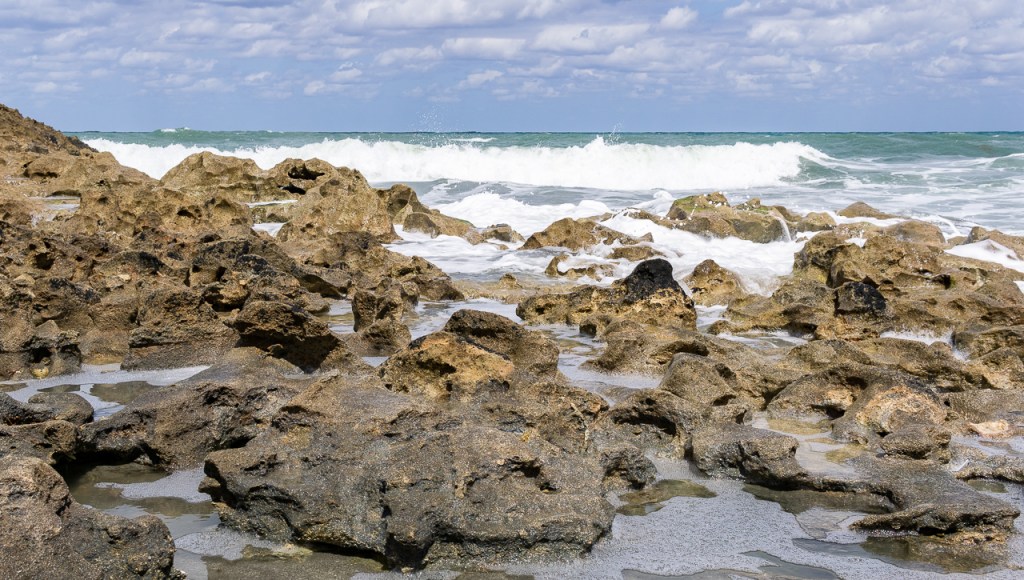
The different chemical and physical weathering processes acting at Blowing Rocks and how they are exhibited are the most interesting aspect of the exposure to me. What’s remarkable about Blowing rocks and the smaller Anastasia outcrops along the coast is that the shoreline exposures create a somewhat rocky erosional coastline, a rare sight for the sandy beaches and calm, mangrove-laden Florida coasts.
Beach drift carved into the coastline. As waves strike the beach at an angle, they rush up the shore face and wash back to the sea at a mirrored angle, creating a zig zag pattern along the coast. While watching the waves wash up the formation, I noticed a second process increasing the concave recession in the shore face from the beach drift. The water that makes it to the top of the sea cliff and ponds there slowly flows back to the sea concentrated in channels, incising the channel into the rock.
A wave-cut platform in the formation. As the front of the cliff collapses from the wave-cut notch, it leaves a flat platform that widens as the process repeats.
A wave-cut notch forming. Waves cut a notch into the base of the sea cliff at the high tide line. As the waves cut deeper and deeper into the rock, the cliff falls away into the sea, and the cycle begins again.
Physical and chemical weathering interact and propel each other to create the sharp, jagged, angular, pockmarked surface of the exposure. The force of the impact from the spray of the waves falling down on the surface from above creates small pockmarked depressions, and the seawater collects and slowly dissolves the depressions further, creating dissolution pits. Dissolution pits join and expand at low points on the surface, and shallow rills form where the water flows back down the cliff. The exposure at Blowing Rocks is highly bioturbated. Small marine organisms burrowed into the substrate after it was deposited, creating mud lined horizontal and vertical tunnels. The mud lined burrows are harder and more firmly consolidated than the surrounding shell fragment coquina, so they remain as rod-like structures as the coquina is eroded away first. Another photo showing bioturbation and the pitted texture of the surface.A third photo showing bioturbation and the pitted surface.
Calcium carbonate crusts on the surface of the exposure. The crusts are botryoidal (globular) growths, formed from calcite crystallizing from supersaturated waters at the exposure surface. Calcite crystals precipitate around an obstruction, forming a nucleus around it. More crystals precipitate around the nucleus, forming clusters of spherical growths. The growths have since mostly eroded away, leaving just the bottom of the crusts.The exposure grades into the sand to the south. At this southern end the surface is much more rounded, due to it being low enough for the tide to continuously wash over and erode it.